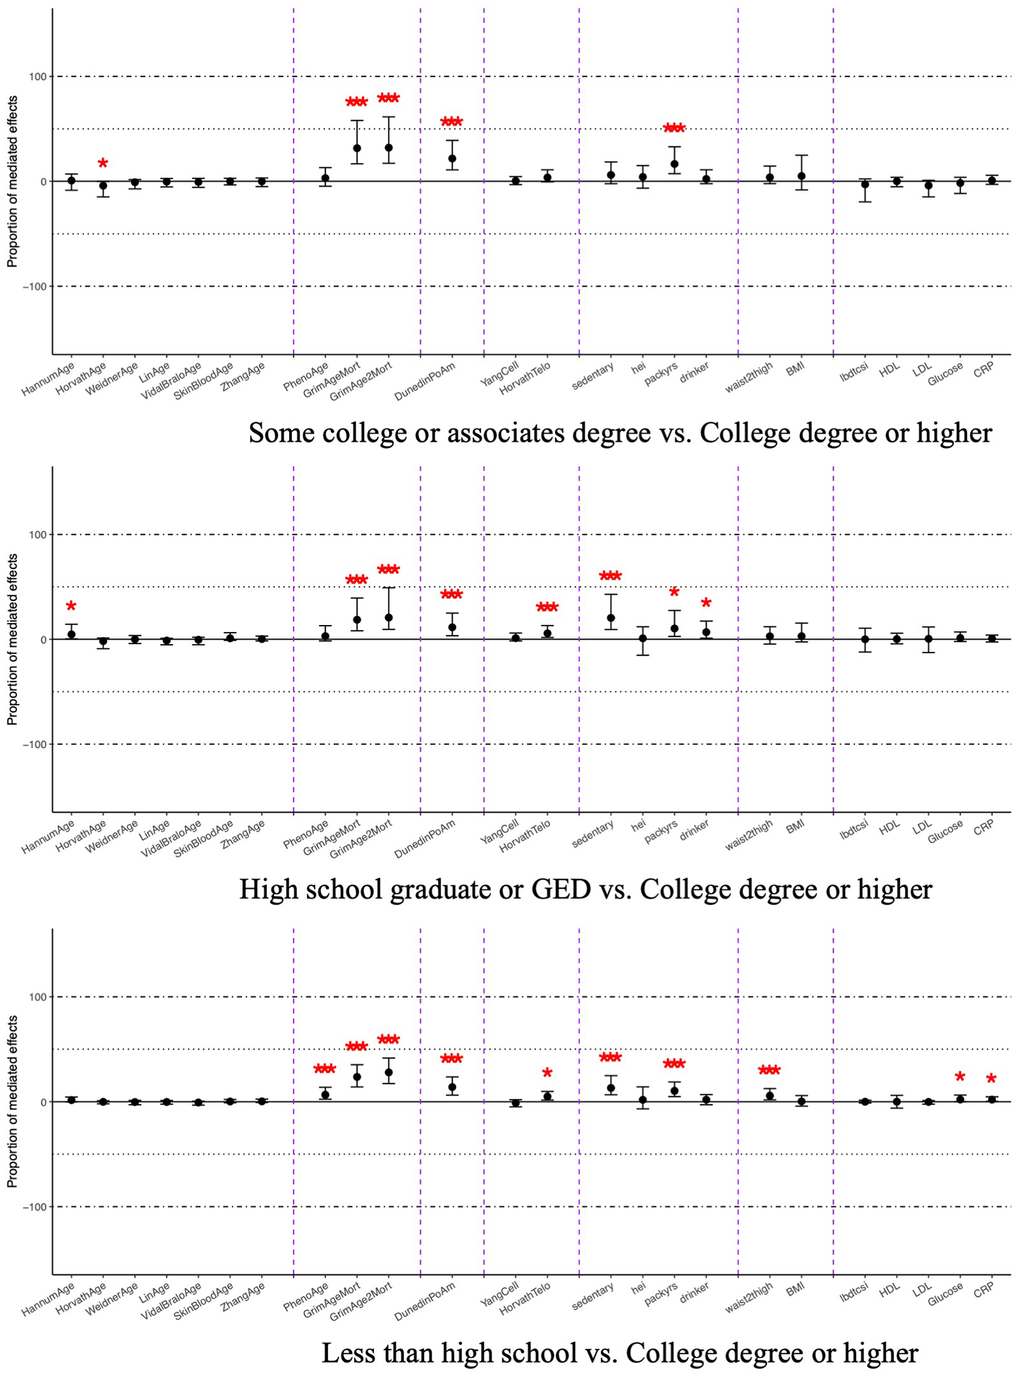
Figure 3.Average mediated proportions for DNA methylation and clinical mediators on the relationship between education attainment and all-cause mortality, NHANES 1999-2002 (n=2,402). Coefficients marked with one asterisk indicate statistical significance (p < 0.05), and those with three asterisks indicate significance after Bonferroni correction (p < 0.0021). The x-axis is ordered as chronological age clocks, physiological functioning clocks, pace-of-aging clock, clocks trained on other aging biomarkers, and behavioral, anthropometric, and clinical mediators.