Submit an Article
Navigate
Home
Editorial Board
Editorial Policies
Current Volume
Archive
Scientific Integrity
Publication Ethics Statements
Interviews with Outstanding Authors
Newsroom
Sponsored Conferences
Podcast
Contact
Special Collections
Submit an Article
Online ISSN: 1945-4589
Research Paper
|
Volume 17, Issue 4
|
pp. 994–1010
Dietary associations with reduced epigenetic age: a secondary data analysis of the methylation diet and lifestyle study
Back to article
Figure 3
(3 of 3)
−
100%
+
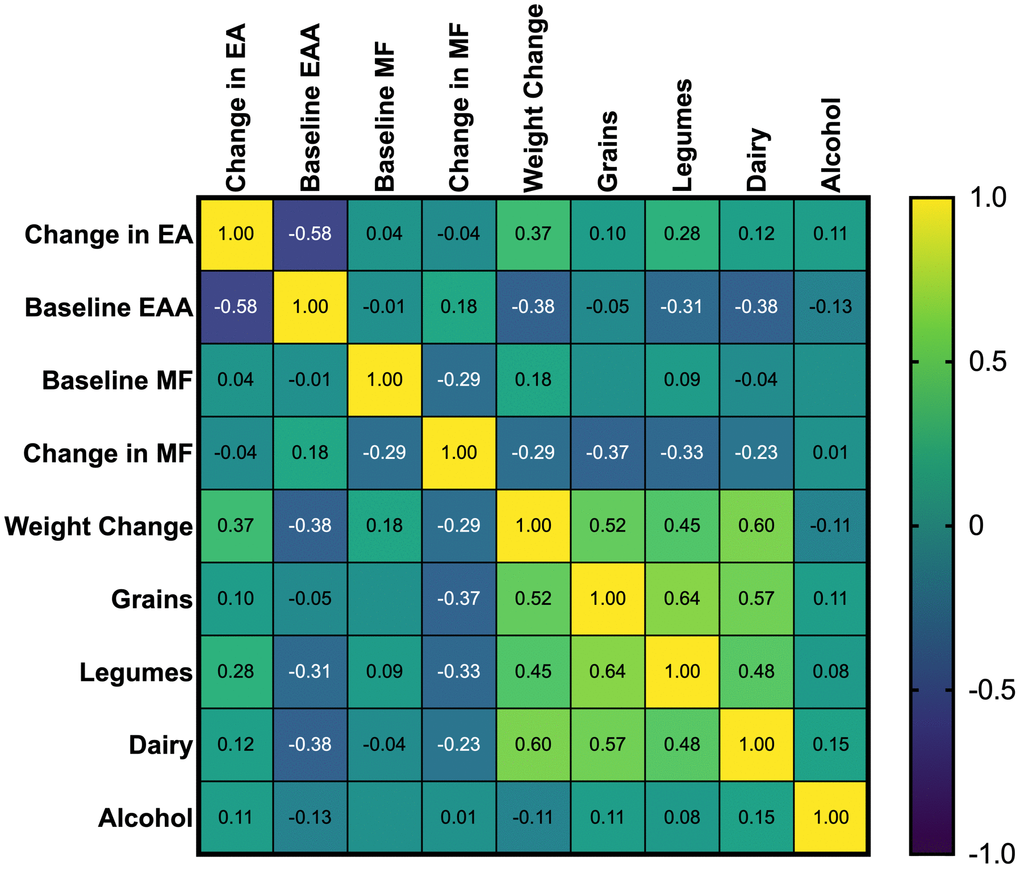
Figure 3.
Spearman’s correlation coefficients of study restricted food groups and baseline EAA, and change in epigenetic age.
Figure 3 — Dietary associations with reduced epigenetic age: a secondary data analysis of the methylation diet and lifestyle study | Aging