Submit an Article
Navigate
Home
Editorial Board
Editorial Policies
Current Volume
Archive
Scientific Integrity
Publication Ethics Statements
Interviews with Outstanding Authors
Newsroom
Sponsored Conferences
Podcast
Contact
Special Collections
Submit an Article
Online ISSN: 1945-4589
Research Paper
|
Volume 17, Issue 3
|
pp. 726–739
Sildenafil and risk of Alzheimer disease: a systematic review and meta-analysis
Back to article
Figure 3
(3 of 4)
−
100%
+
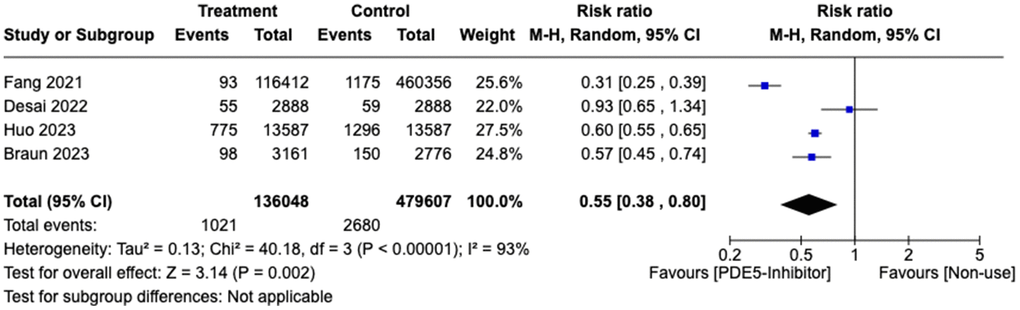
Figure 3.
Forest plot of risk ratio (RR) of patients developing Alzheimer disease in treatment vs. control group.