Submit an Article
Navigate
Home
Editorial Board
Editorial Policies
Current Volume
Archive
Scientific Integrity
Publication Ethics Statements
Interviews with Outstanding Authors
Newsroom
Sponsored Conferences
Podcast
Contact
Special Collections
Submit an Article
Online ISSN: 1945-4589
Research Paper
|
Volume 17, Issue 1
|
pp. 217–231
The comparison of serum bone-turnover markers in different stage of chronic kidney disease and the associated impact of intradialytic cycling in patients with end-stage renal disease
Back to article
Figure 2
(2 of 2)
−
100%
+
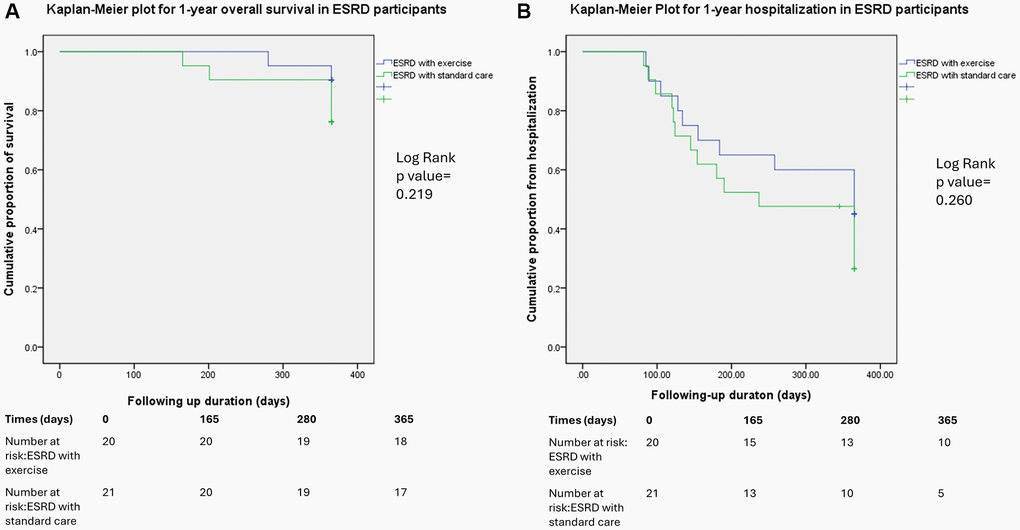
Figure 2.
Kaplan–Meier plot comparing the hospitalization (
A
) and overall survival rates (
B
) between the ESRD groups with and without the exercise intervention at the 1-year follow-up.