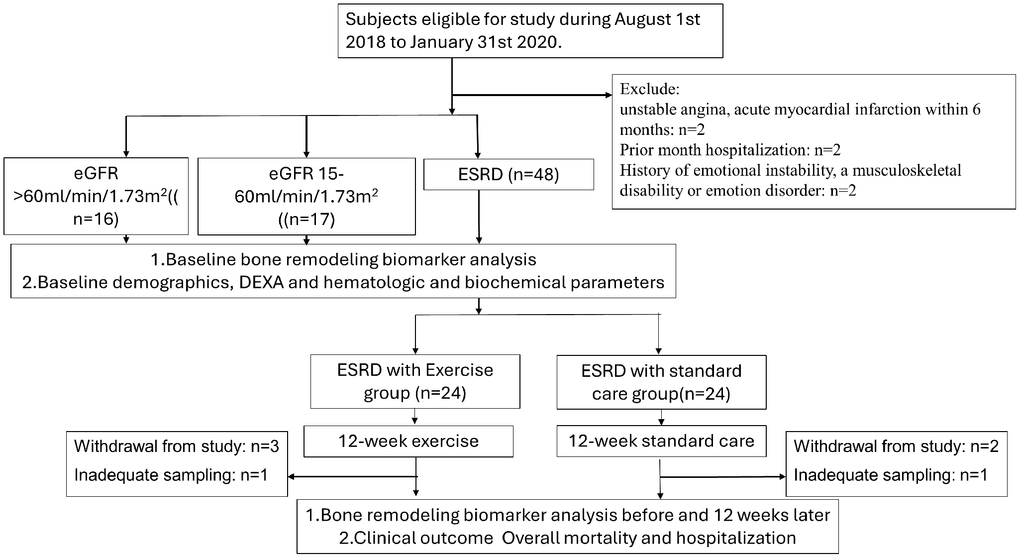
Figure 1.The flow chart of the clinical trial for ESRD participants.
Figure 1 — The comparison of serum bone-turnover markers in different stage of chronic kidney disease and the associated impact of intradialytic cycling in patients with end-stage renal disease | Aging