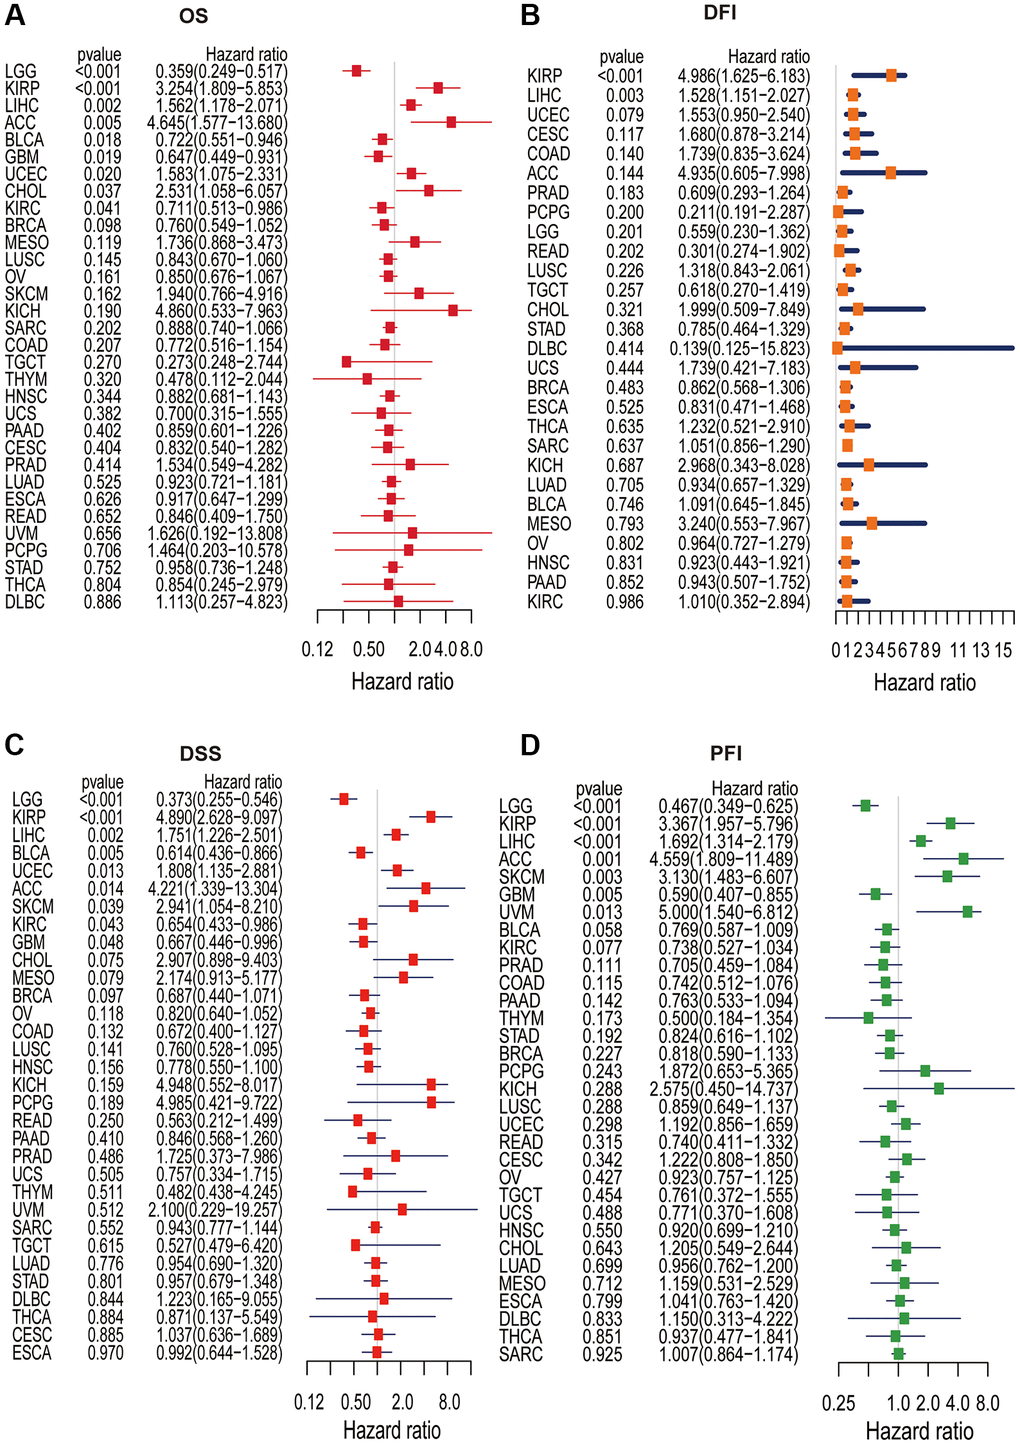
Figure 4.Univariate Cox regression analysis of KLHL23. (A–D) The forest plot shows the relationship between KLHL23 expression and patient overall survival (OS), disease-free interval (DFI), disease-specific survival (DSS), and progression-free interval (PFI). (*P < 0.05, **P < 0.01, ***P < 0.001).