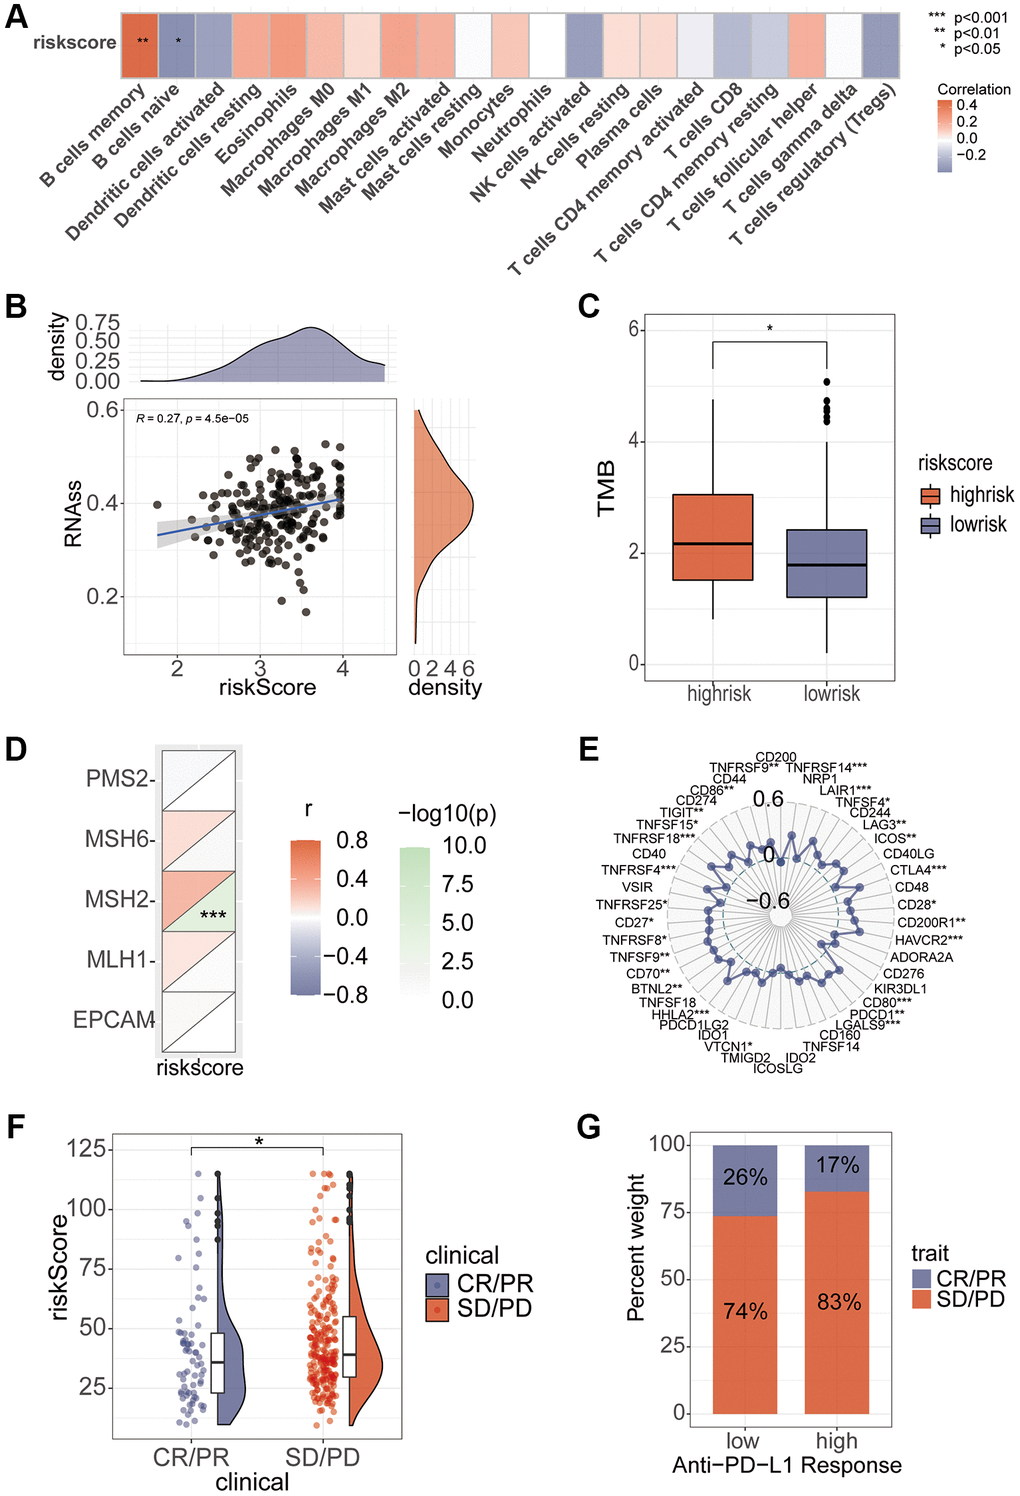
Figure 8.Association of riskScore with immunity. (A) Correlation of riskScore with immune cells. (B) Tumor stem cell relevance. (C) Differences in TMB scores in high and low risk groups. (D, E) Correlation of Mismatch Repair gene and immune checkpoints with riskScore. (F, G) Assessing differences in risk scores between immune efficacy groups.