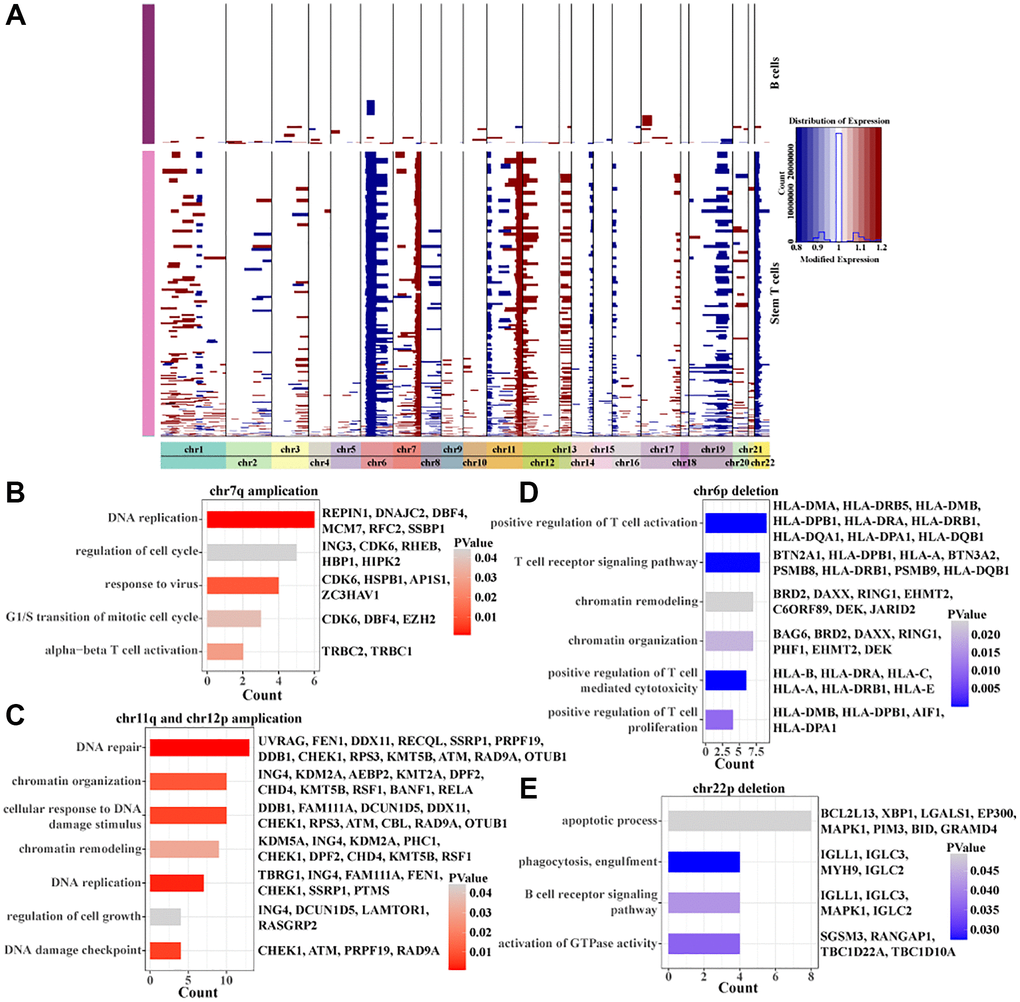
Figure 4.Inscription of copy number variation within Stem T cells. (A) Heatmap of copy number variation within Stem T cells analyzed by inferCNV. (B) BPs enriched for chr7p amplicons. (C) BPs enriched for chr11q and chr12p amplicons. (D) BPs enriched for chr6p deletions. (E) BPs enriched for chr22p deletions.