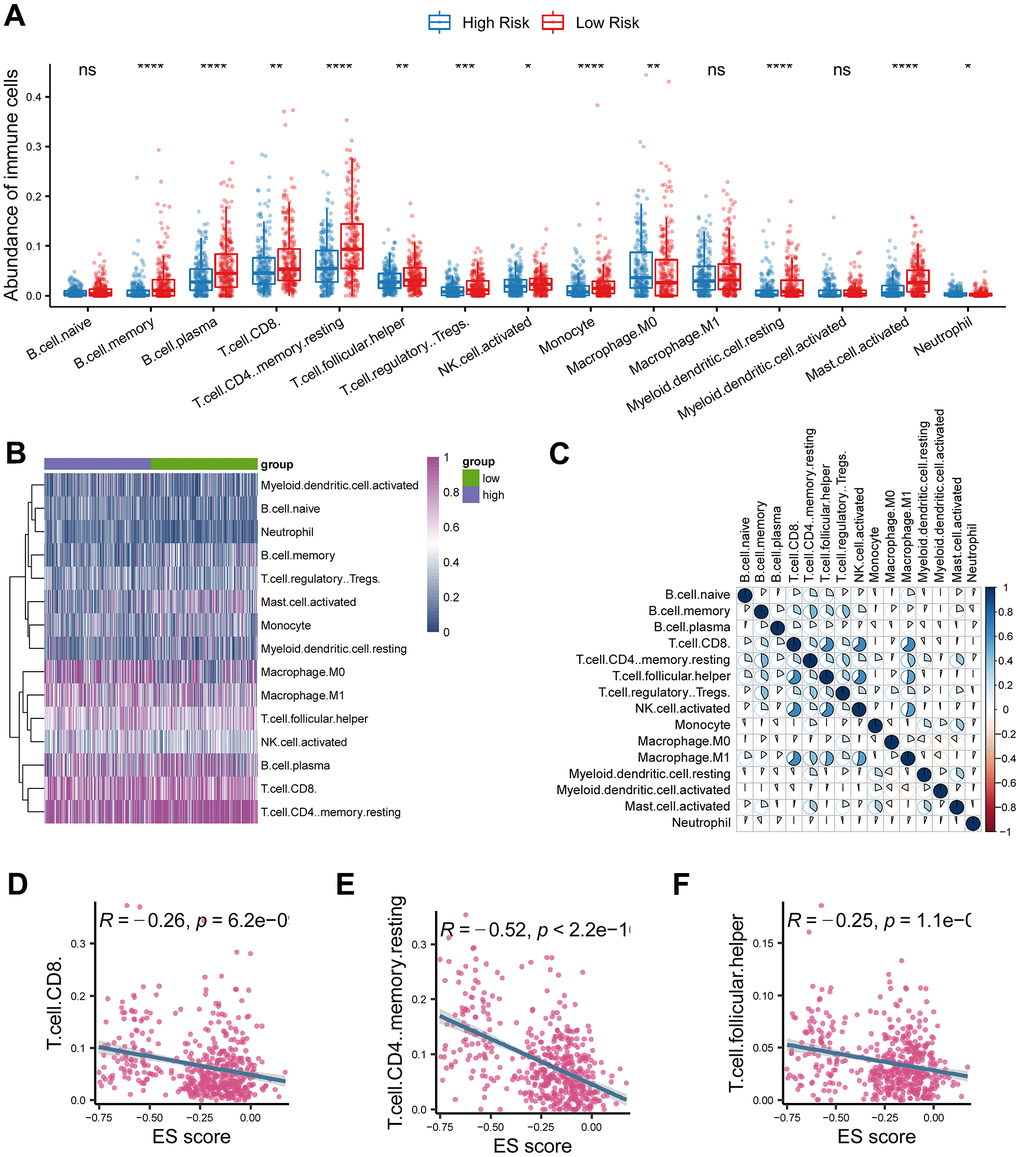
Figure 5.Investigation of tumor immune microenvironment of lung adenocarcinoma. (A) Comparison of tumor-infiltrating immune cells between cancerous and normal tissue. (B) Heatmap analysis of tumor-infiltrating immune cells in lung adenocarcinoma. (C) Correlations analysis of tumor-infiltrating immune cells in lung adenocarcinoma. (D–F) The risk score based on the ferroptosis-related gene signature was negatively correlated with CD8 T cell, CD4 T cell, and follicular helper T cell. * represents P < 0.05, ** represents P < 0.01, *** represents P < 0.001.