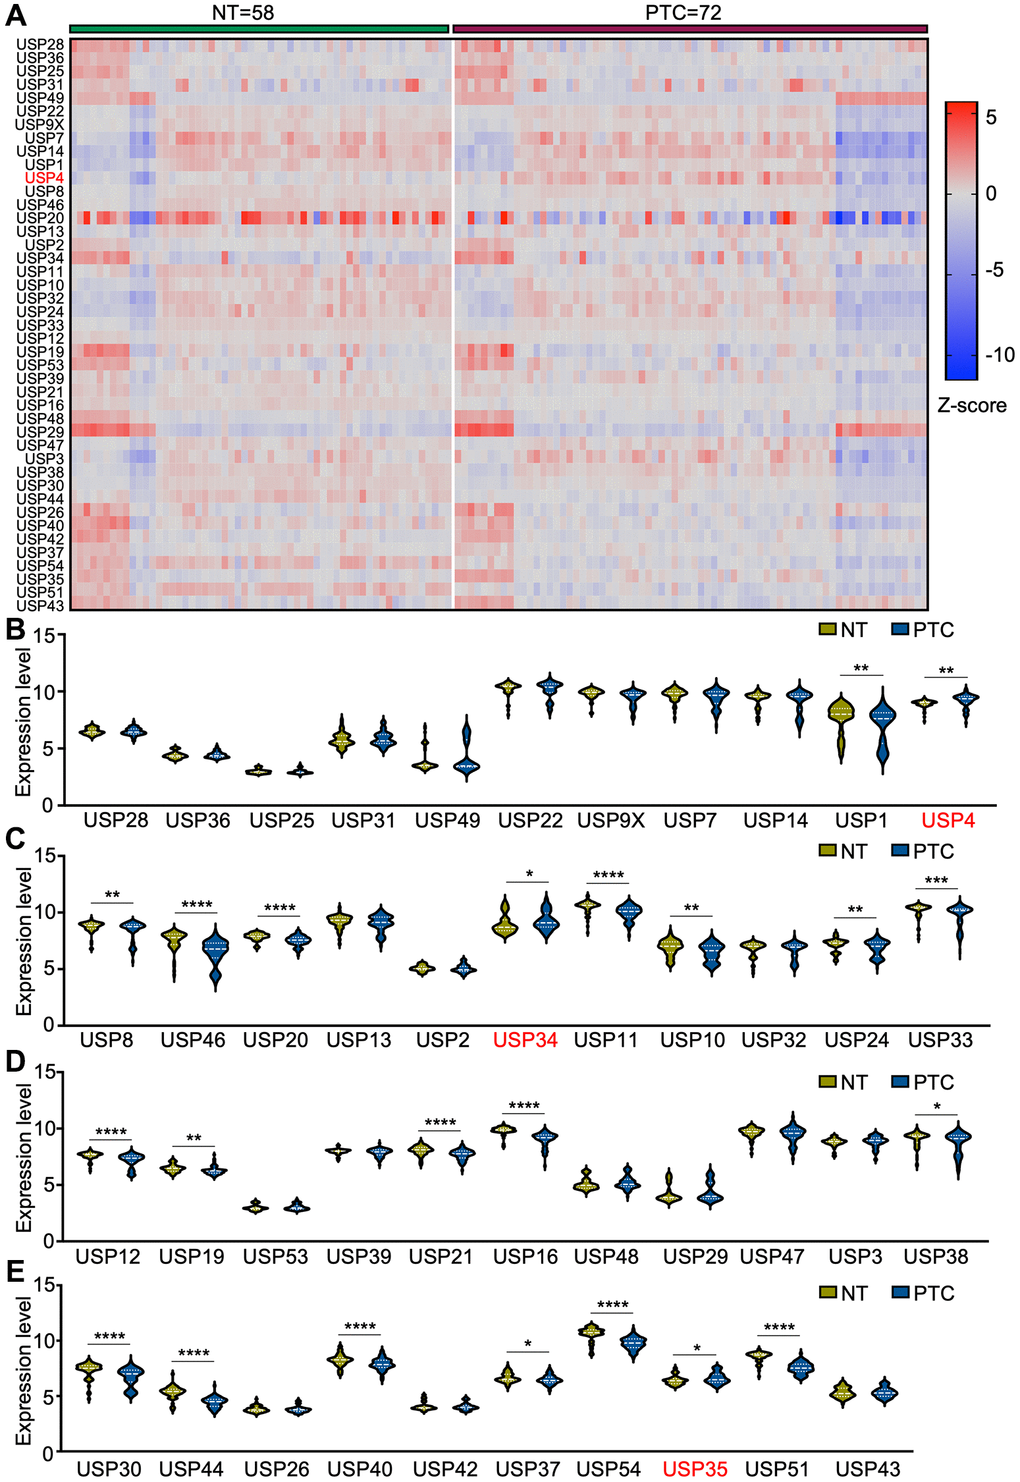
Figure 1.Differential expression analysis of USP genes in PTC patients. (A) Heat map representing USP gene expression profiles in PTC and adjacent normal thyroid tissues, derived from four GEO databases (GSE3467, GSE6004, GSE33630, and GSE76039); (B–E) Violin plots illustrating USP gene expression profiles in PTC and adjacent normal thyroid tissues across the four aforementioned GEO databases. All *p < 0.05, **p < 0.01, ***p < 0.001, ****p < 0.0001.