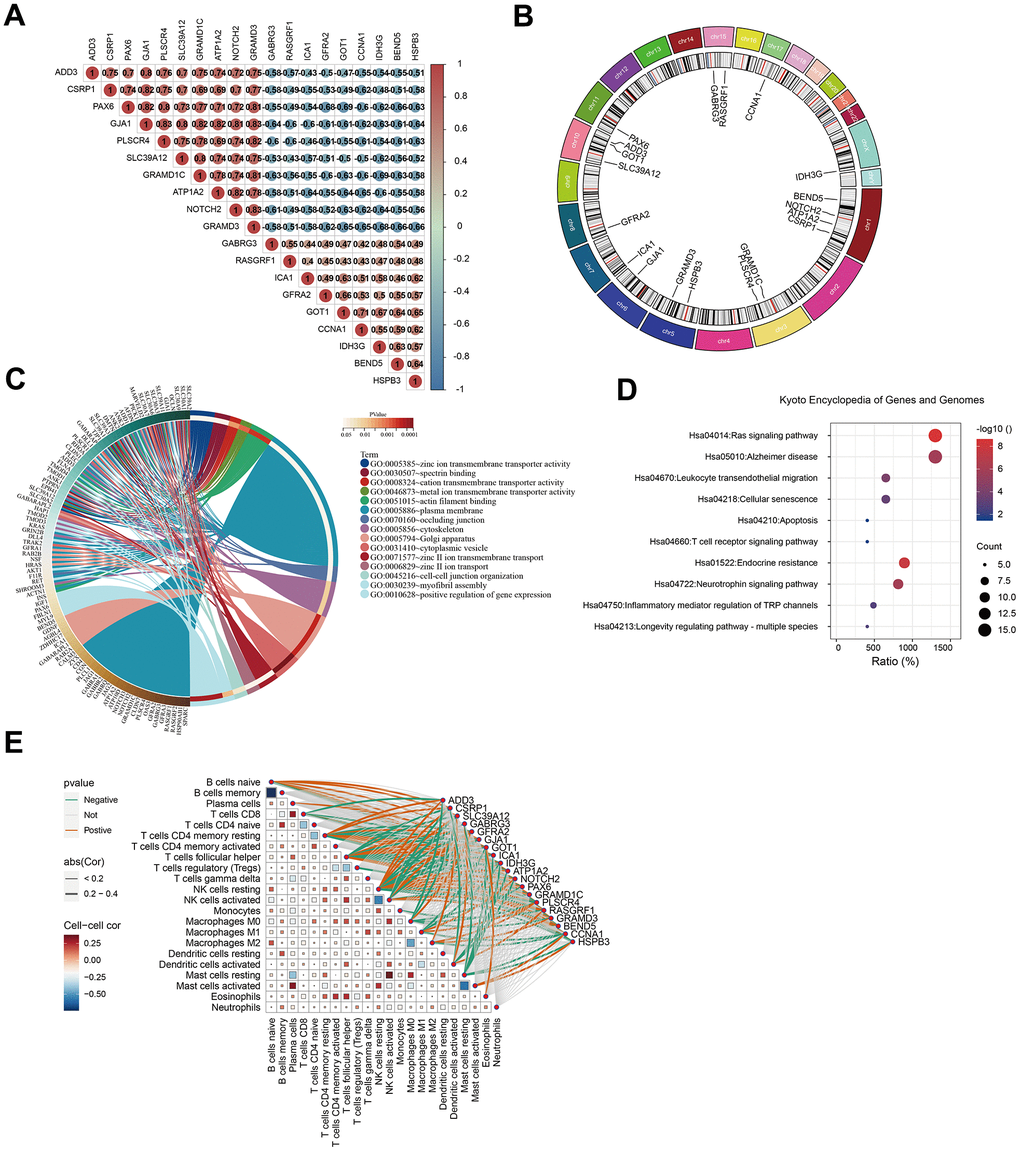
Figure 5.Analysis of GJA1-related genes. (A) Heatmap showing GJA1-related genes. (B) Chromosomal location distribution map of genes related to GJA1. (C) Circle map of GO analysis of the genes related to GJA1. (D) Circle map of KEGG analysis of the genes related to GJA1. (E) Correlation of the genes related to GJA1 with the immune cells.