Submit an Article
Navigate
Home
Editorial Board
Editorial Policies
Current Volume
Archive
Scientific Integrity
Publication Ethics Statements
Interviews with Outstanding Authors
Newsroom
Sponsored Conferences
Podcast
Contact
Special Collections
Submit an Article
Online ISSN: 1945-4589
Research Paper
|
Volume 16, Issue 18
|
pp. 12593–12607
Study of the role of leukocyte telomere length-related lncRNA NBR2 in Alzheimer’s disease
Back to article
Figure 3
(3 of 6)
−
100%
+
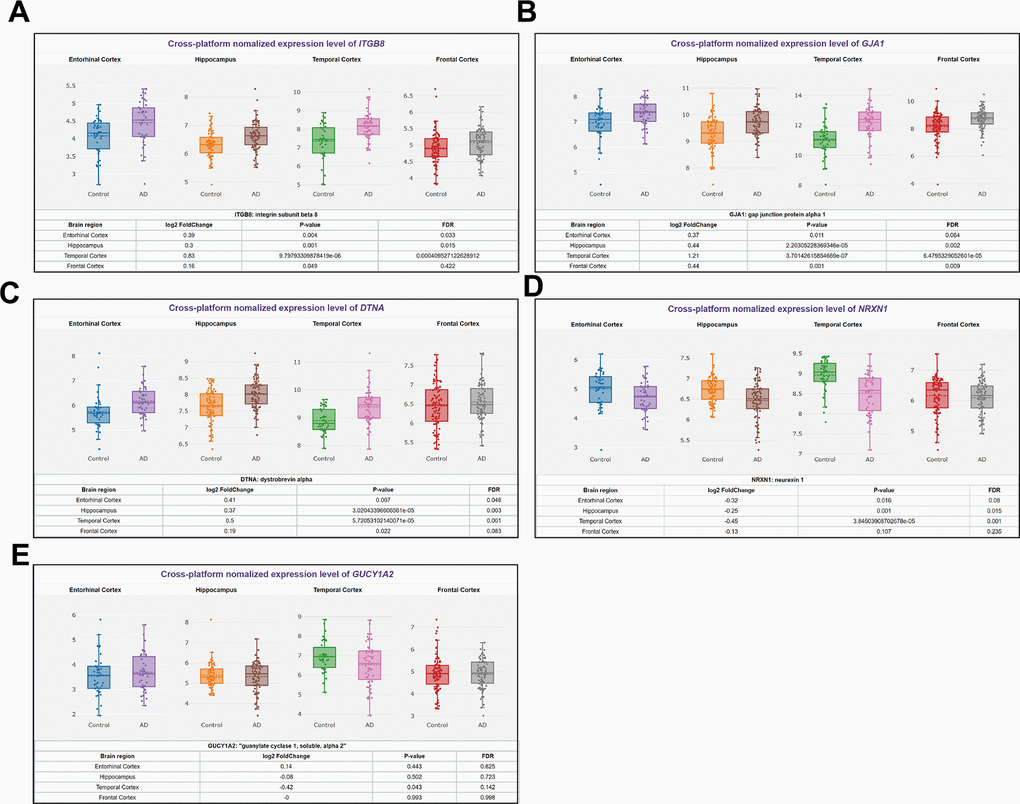
Figure 3.
Differences in expression levels of 5 predicted mRNAs in primary brain tissues of AD patients.
(
A
) ITGB8, (
B
) GJA1, (
C
) DTNA, (
D
) NRXN1, and (
E
) GUCY1A2 expression in Entorhinal Cortex, Hippocampus, Temporal Cortex, Frontal Cortex.
Figure 3 — Study of the role of leukocyte telomere length-related lncRNA NBR2 in Alzheimer’s disease | Aging