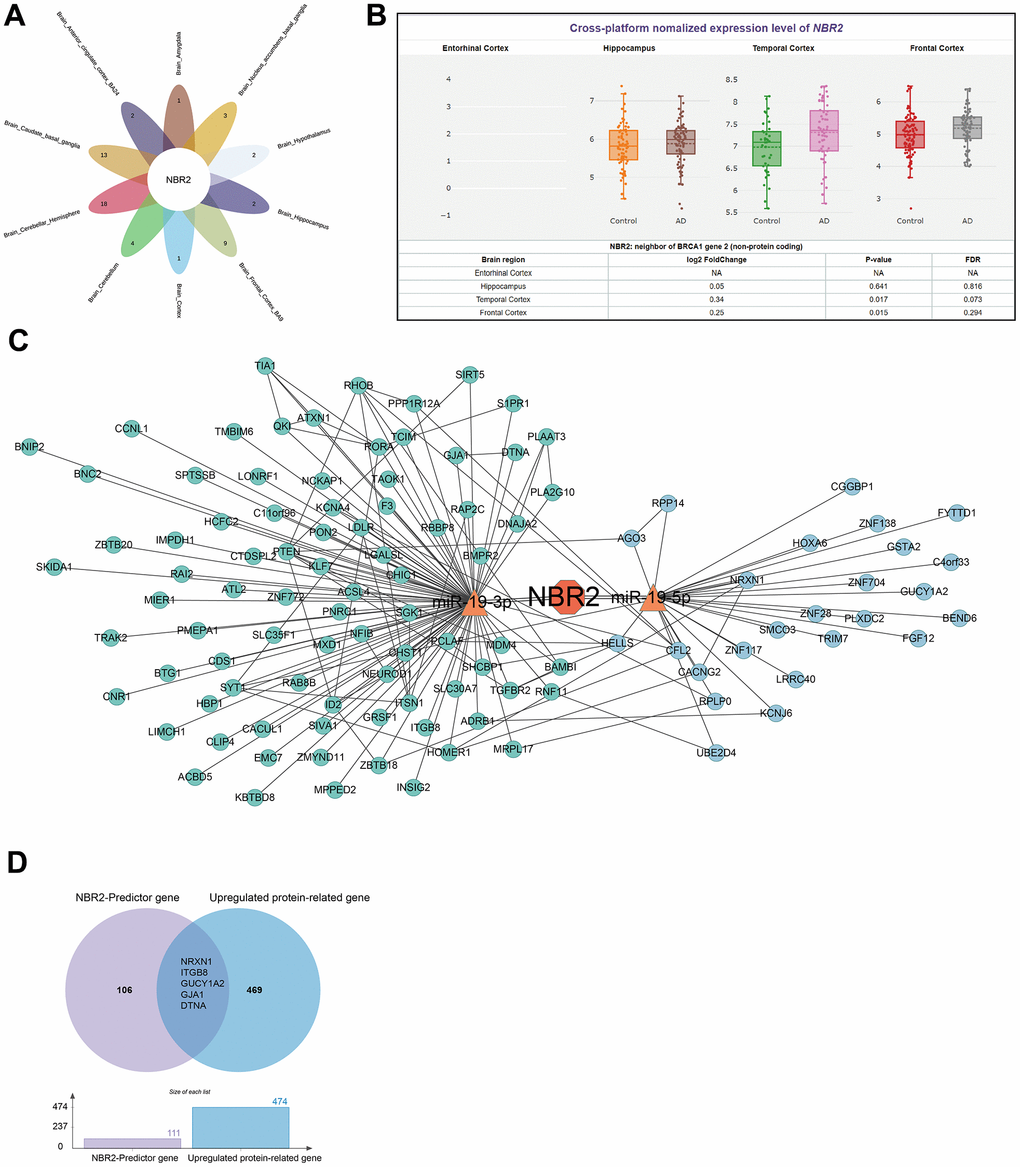
Figure 2.Analysis of genes corresponding to IVs-associated SNPs. (A) Venn diagram demonstrating that NBR2 is a core gene in various parts of the brain tissue. (B) Violin diagram demonstrating the expression of NBR2 in the significant components of the brain. (C) NETWORK diagram demonstrating miRNAs and mRNAs downstream of NBR2. (D) The Venn diagram demonstrates the high expression of 5 genes at both the protein and gene levels.