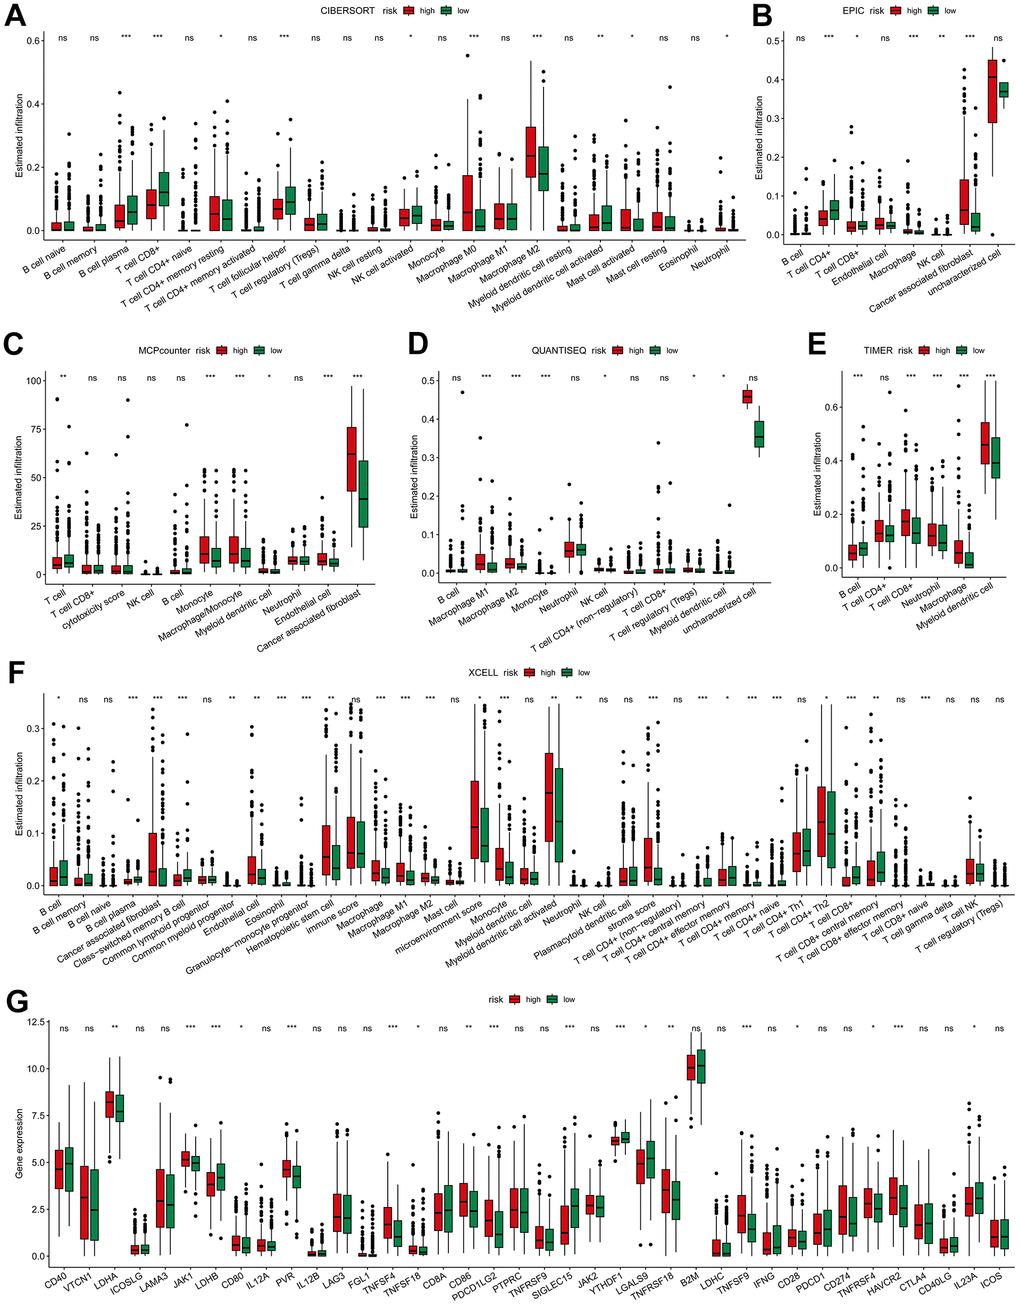
Figure 6.Immune-related association of the risk model. The difference of high- and low-risk groups in tumor immune landscape evaluated by (A) CIBERSORT, (B) EPIC, (C) MCP-Counter, (D) QUANTISEQ, (E) TIMER and (F) XCELL. (G) Differences in the immune checkpoint-related genes expression between high- and low-risk groups. * p < 0.05, ** p < 0.01, *** p < 0.001.