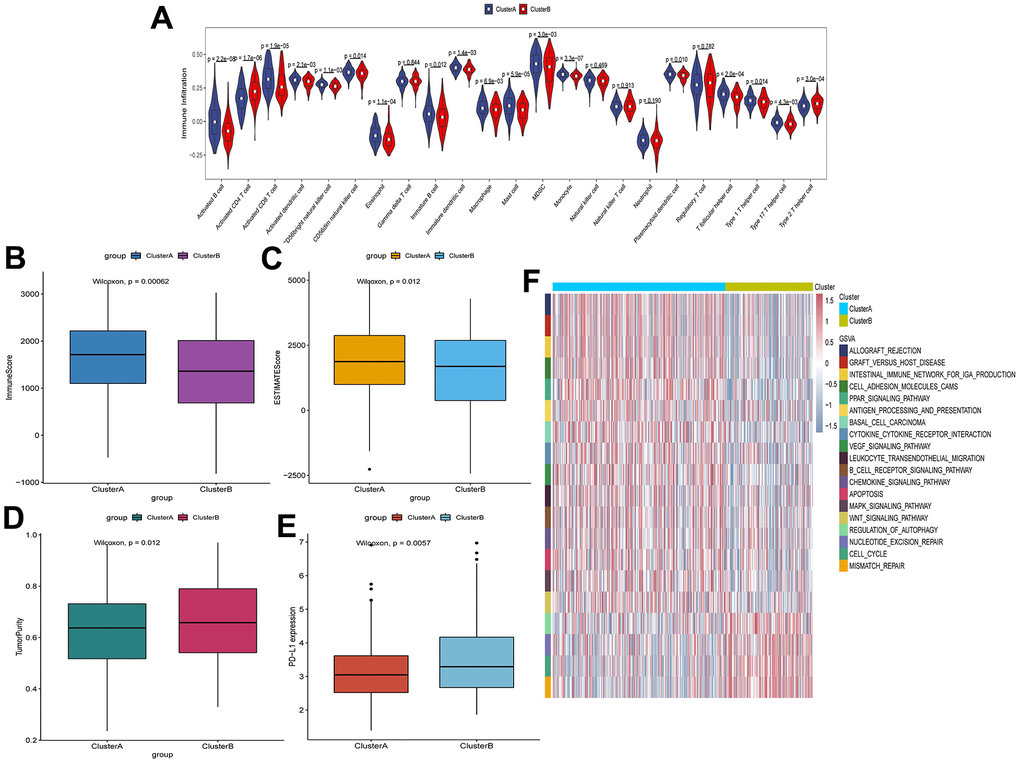
Figure 3.Characteristics of cell infiltration in TIME of clusterA and clusterB subtypes in TCGA. (A) The degree of immune cell infiltration in TIME of clusterA and clusterB subtypes; (B) Immunoscore in clusterA and clusterB subtypes; (C) ESTIMATEscore in clusterA and clusterB subtypes; (D) Tumor purity in clusterA and clusterB subtypes; (E) Expression level of PD-L1 in clusterA and clusterB subtypes; (F) GSVA enrichment analysis of clusterA and clusterB subtypes.