Submit an Article
Navigate
Home
Editorial Board
Editorial Policies
Current Volume
Archive
Scientific Integrity
Publication Ethics Statements
Interviews with Outstanding Authors
Newsroom
Sponsored Conferences
Podcast
Contact
Special Collections
Submit an Article
Online ISSN: 1945-4589
Research Paper
|
Volume 16
Efficacy of Compound Danshen Dripping Pills in patients with acute myocardial infarction undergoing percutaneous coronary intervention: a meta-analysis
Back to article
Figure 6
(6 of 9)
−
100%
+
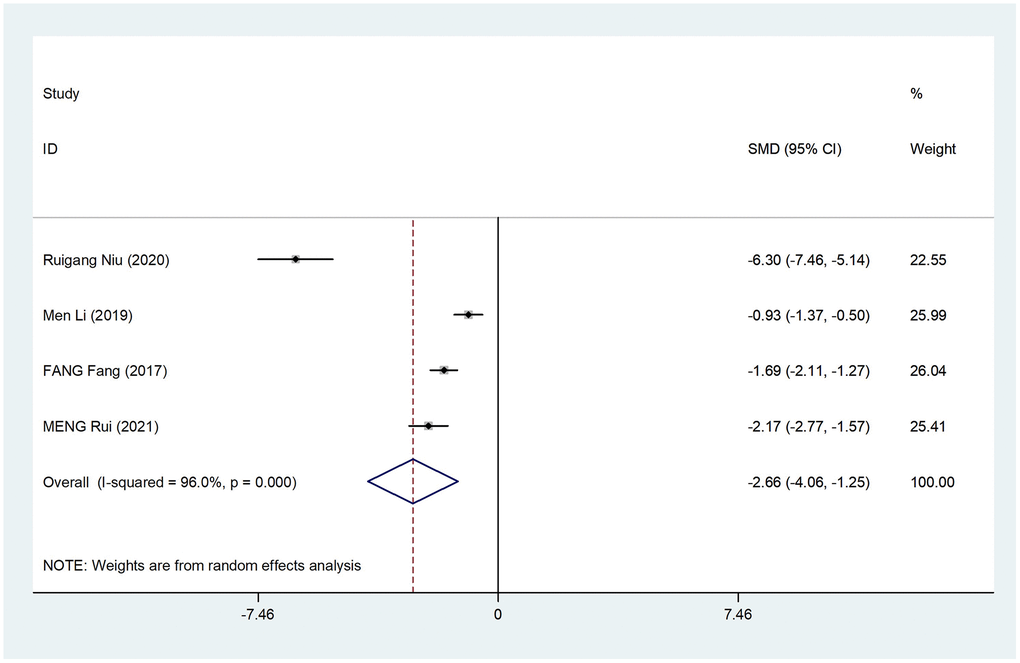
Figure 6.
Forest plot evaluating BNP in individuals with and without CDDP use.
The consolidated results are presented as SMD along with their respective 95% CI.