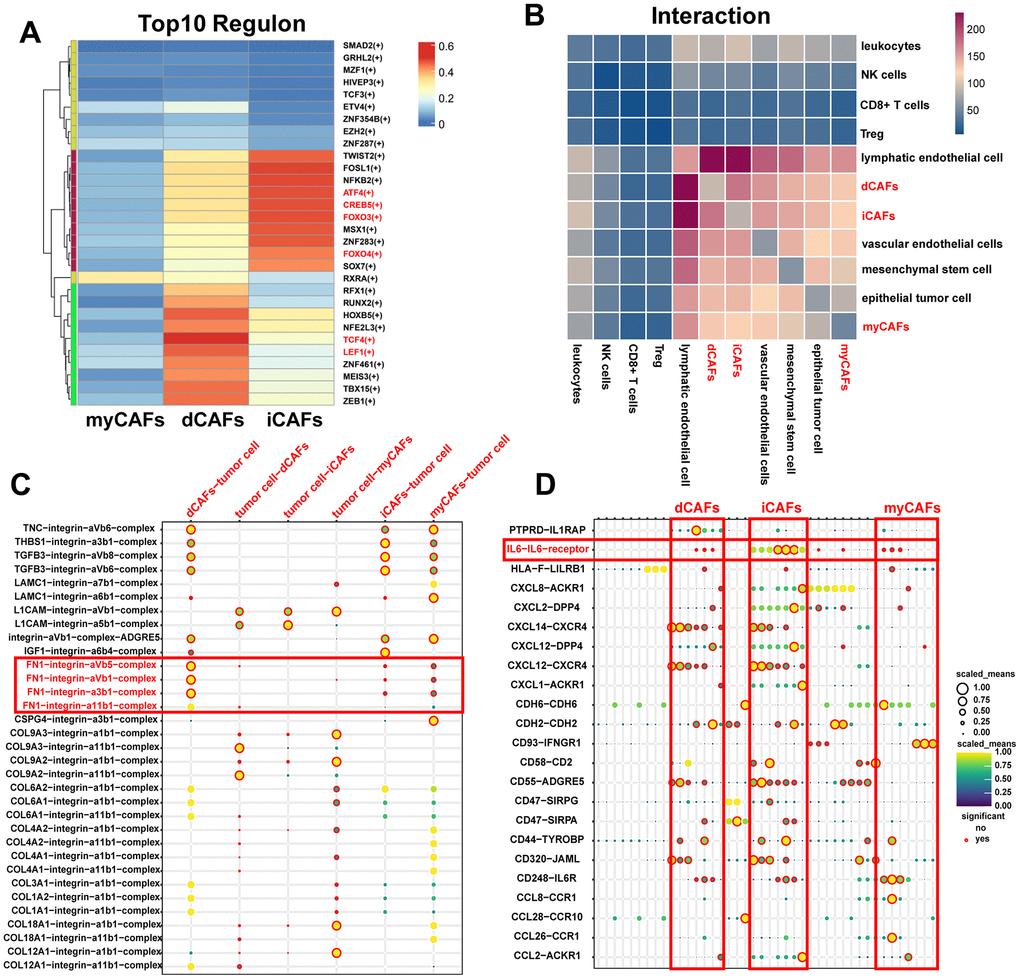
Figure 4.TFs and cell-cell communication of CAF subgroups. (A) Heatmap of the top ten TF regulons in CAF subgroups ranked by RSS scores, with color representing relative RSS values. (B) Heatmap showing cell types with significant correlations. The color represents the number of receptor-ligand pairs between cells. (C) ECM-related receptor-ligand pairs between CAF subpopulations and tumor cells with P < 0.05. (D) Immune-related receptor-ligand pairs between CAF subpopulations and other cell types with P < 0.05.