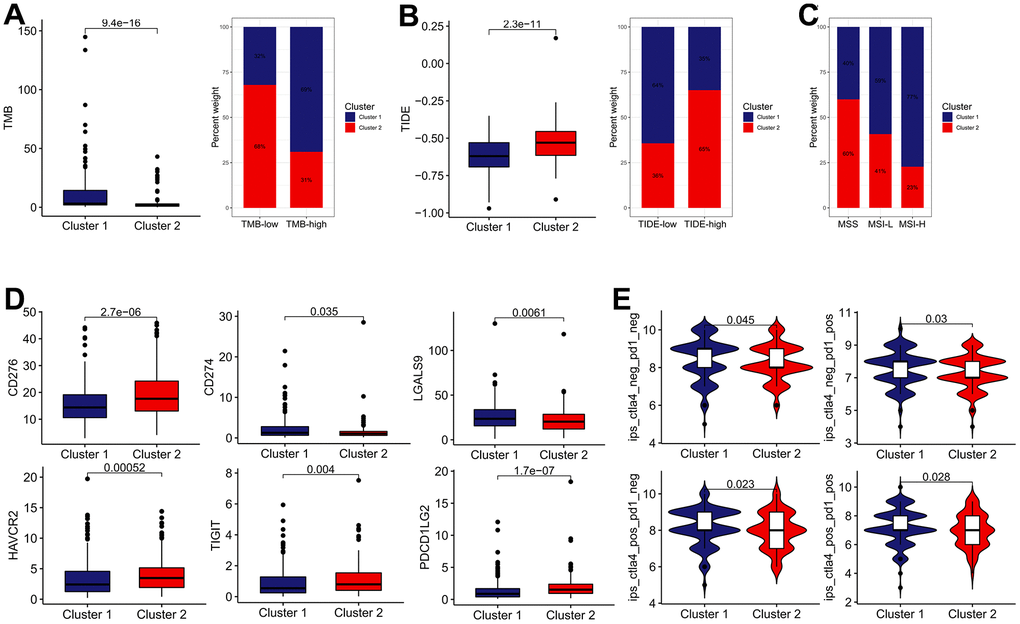
Figure 5.The estimation of two IRGs subtypes in immunotherapy response. (A) The difference in TMB between two distinct subtypes. (B) The difference in TIDE score between two distinct subtypes. (C) Relative proportion of microsatellite instability in two distinct subtypes. (D) The expression of ICBs in two distinct subtypes. (E) The difference of IPS in two distinct subtypes.