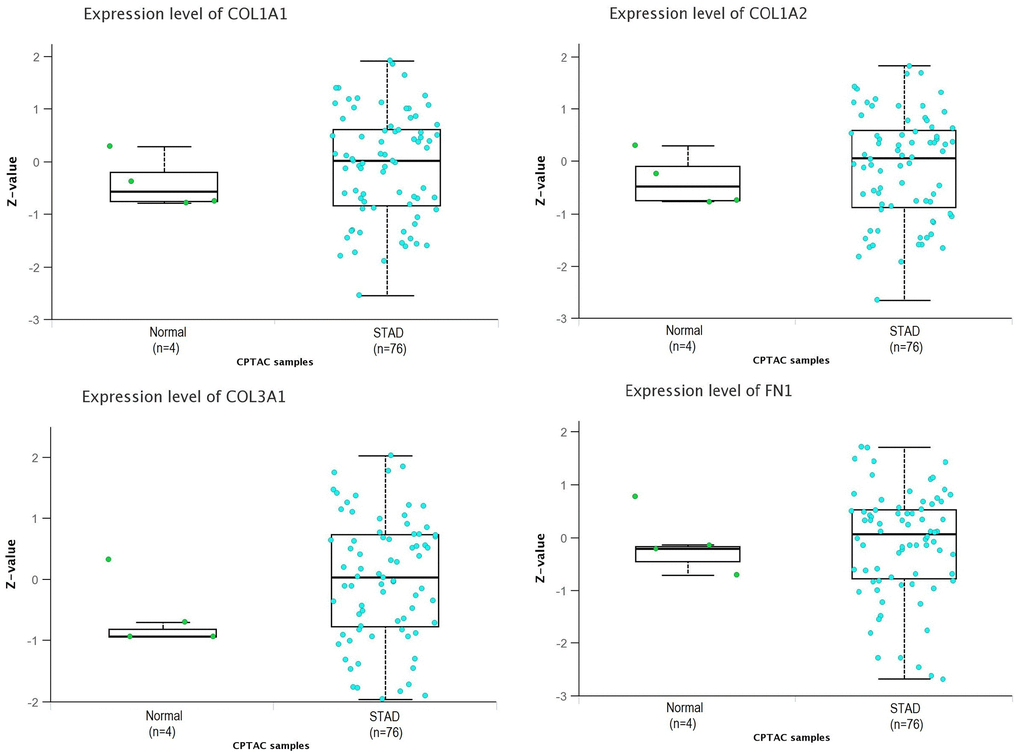
Figure 5.Proteomic expression analysis of COL1A1, COL1A2, COL3A1, and FN1 using additional database. This figure presents the proteomic expression analysis of COL1A1, COL1A2, COL3A1, and FN1 in gastric cancer (GC) and normal samples via UALCAN database. P-value < 0.05.