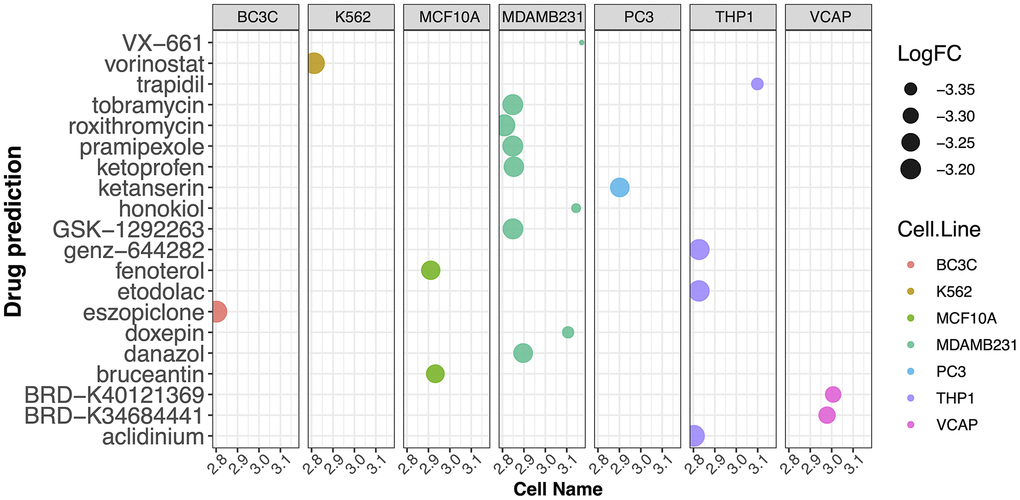
Figure 6.Prediction of drugs targeting the potential diagnostic biomarkers using SigCom LINCS. Top 20 small molecules related to expression regulation that are enriched for the four potential biomarker genes (z-score >3, p-value < 0.05) in seven cell lines.