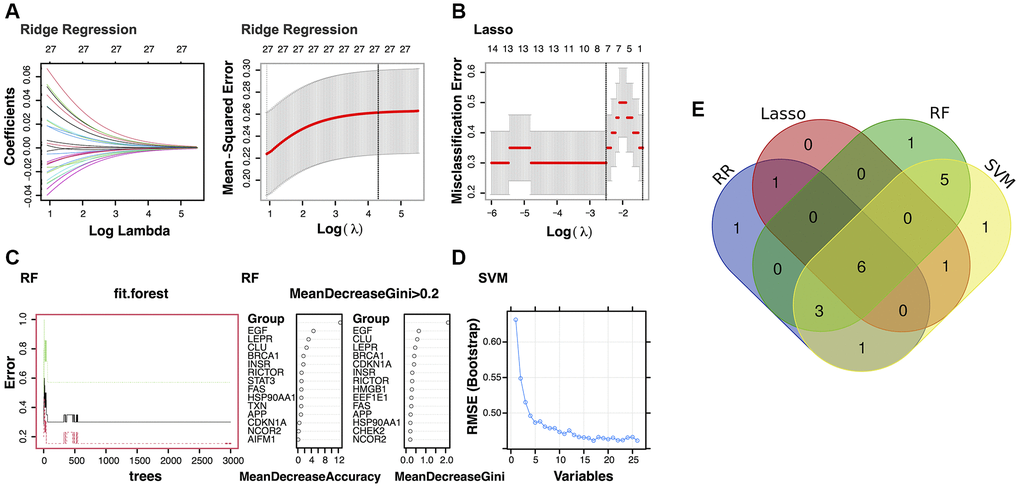
Figure 2.Identification of the potential diagnostic biomarkers from the selected modules. (A) Ridge Regression analysis (RR). (B) Least Absolute Shrinkage and Selection Operator (LASSO) regression analysis. (C) Random Forest (RF) analysis. (D) Support Vector Machine (SVM) analysis. (E) Venn plot exhibiting the biomarkers that were identified by all four algorithms.