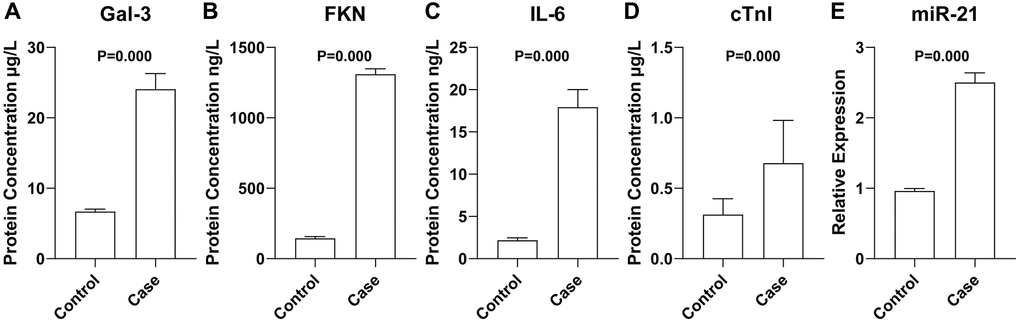
Figure 1.Concentration or expression of Gal-3 (A), FKN (B), IL-6 (C), cTnI (D), and miR-21 (E). Data were presented as mean ± standard deviation and differences between the two groups were calculated by Student’s Independent T-test. N = 78 for each group.