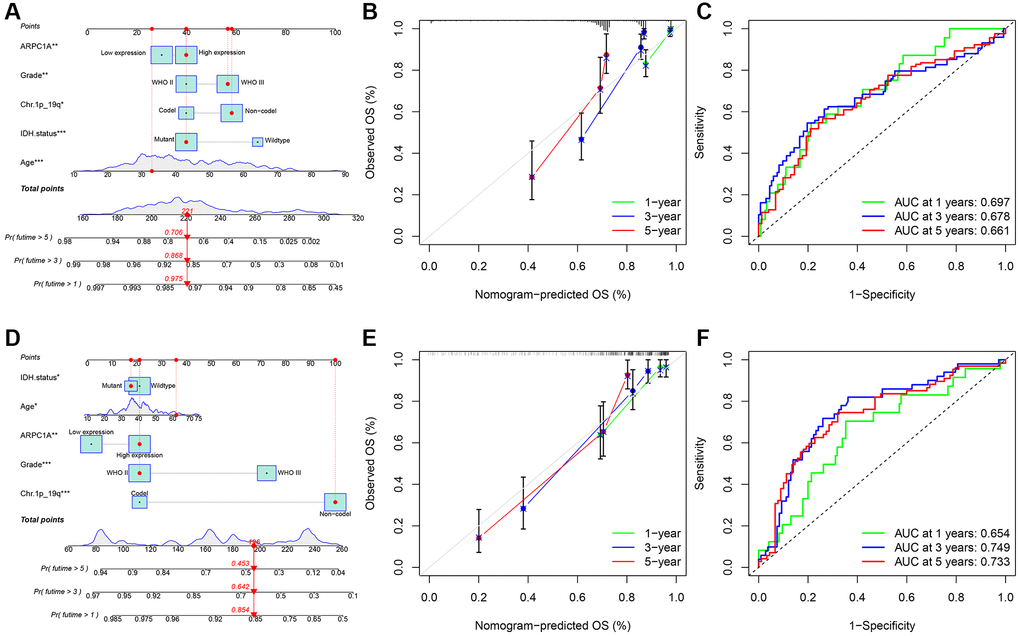
Figure 4.(A–C) TCGA: the nomogram model was constructed and validated through overall survival analysis based on the expression and prognostic information in the TCGA database; ROC analysis of ARPC1A in patients with LGG associated with AUC (area under the curve) validation based on TGGA. (D–F) CGGA: the nomogram model was constructed based on the expression and prognostic information and verified through a calibration curve; ROC analysis of ARPC1A in patients with LGG associated with AUC (area under the curve) validation based on CGGA.