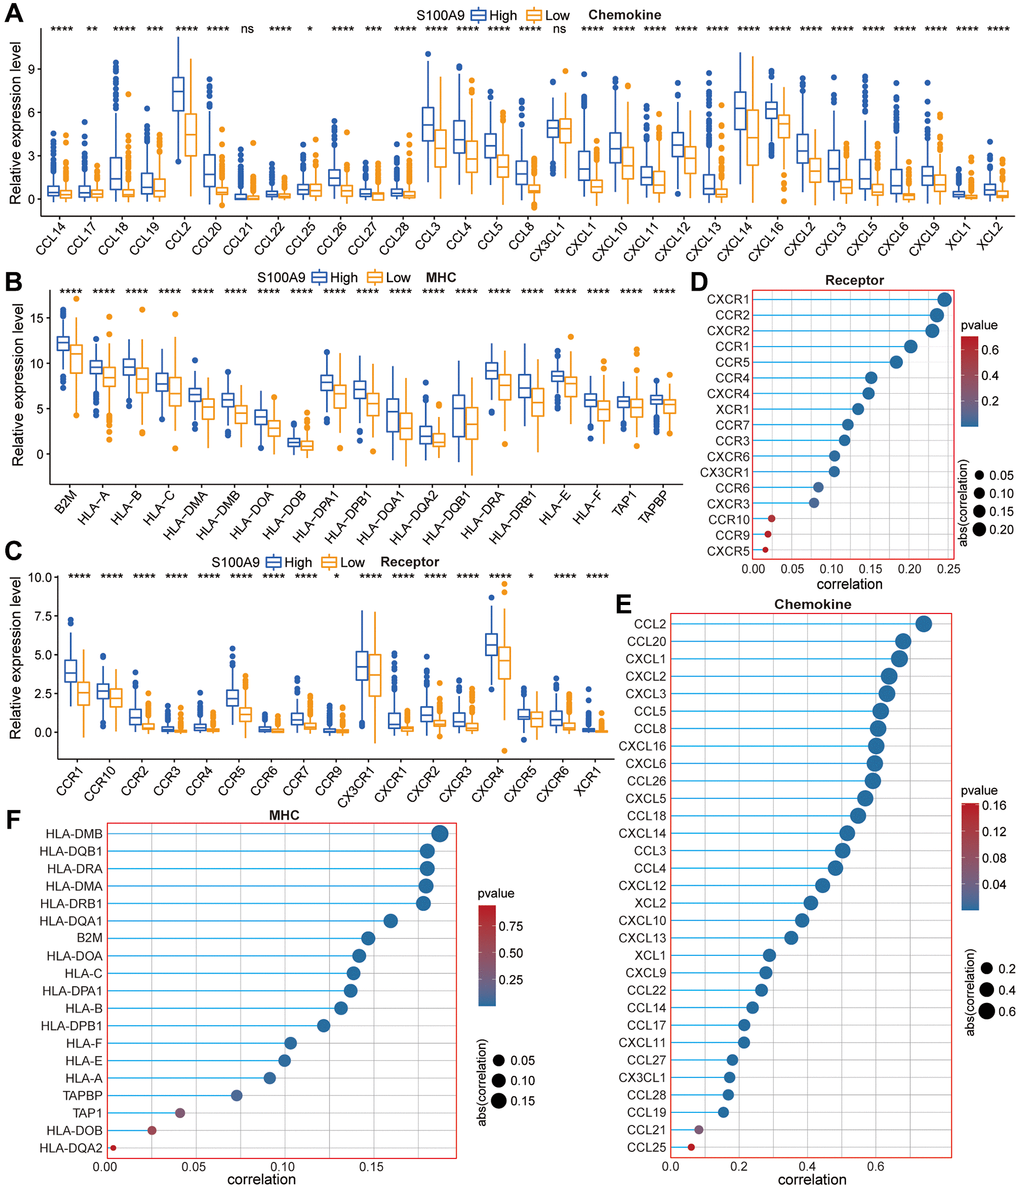
Figure 6.The relationship between S100A9 and the marker genes of the chemokine pathway, receptor pathway, and MHC pathway. (A–C) Differential expression of the marker genes between high- and low-expression groups of S100A9. (D–F) The correlation between S100A9 and the marker genes.