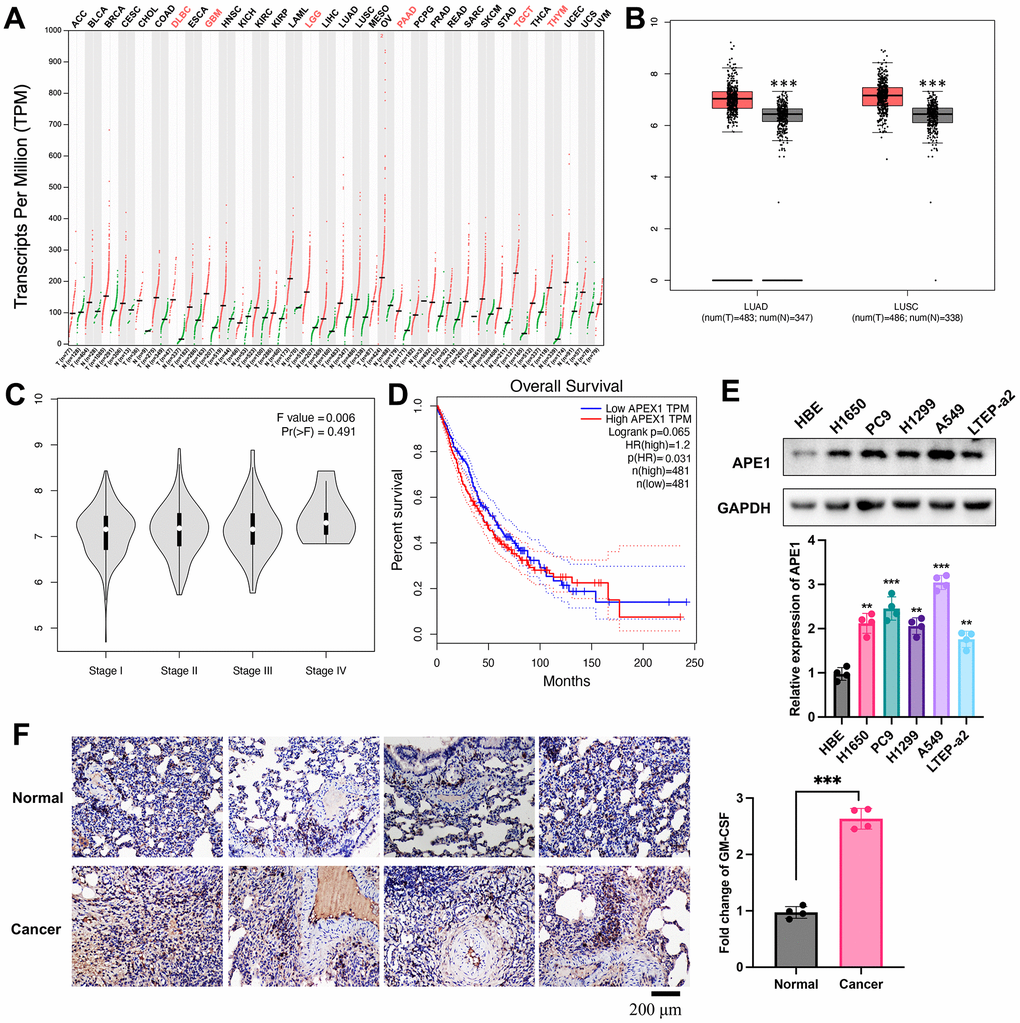
Figure 1.Differential expression of APE1 in lung cancer. (A, B) Analysis of APE1 expression in various tumor types and normal tissues using GEPIA and TCGA databases. (C, D) Negative correlation of decreased APE1 expression with tumor stage and positive correlation with higher survival rate based on GEPIA analysis. (E, F) APE1 expression in cancer cells and tissues measured by Western blotting and IHC staining. **p < 0.01, ***p < 0.001.