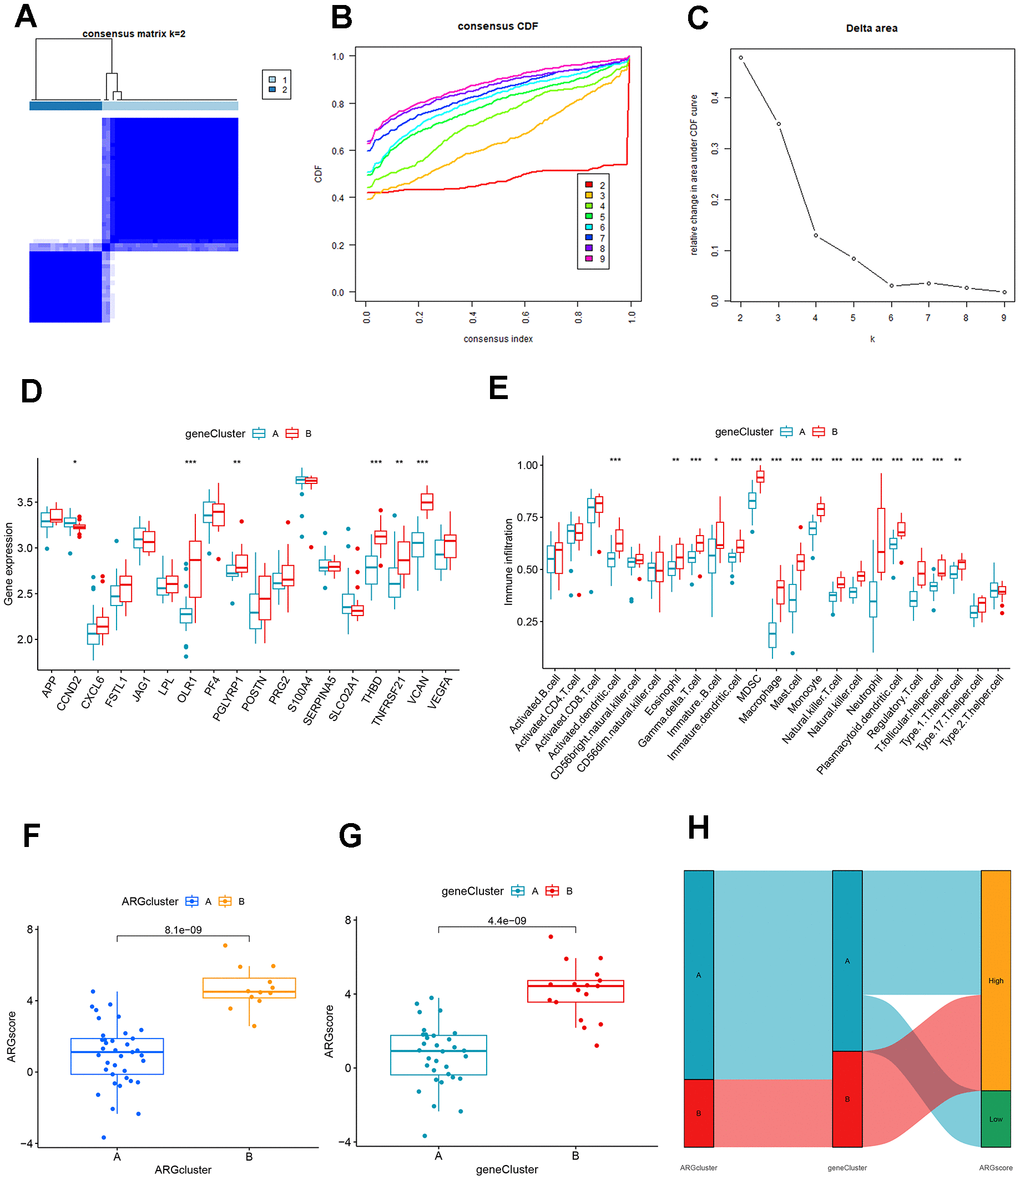
Figure 8.Identification and comparison of different ARG gene patterns. (A) Consensus matrix of DEGs with k=2. (B) CDF of consensus clustering. (C) Delta area plot of consensus clustering. (D) Differential expression analysis of clusters A and B genes based on ARG gene pattern. (E) Association of DEGs with immune cell infiltration in clusters A and B based on ARG gene pattern. (F) ARG score analysis between different clusters based on the ARG model. (G) ARG score analysis between different clusters based on the ARG gene model. (H) The association between ARG patterns, gene cluster, and ARG score was shown on the Sankey diagram.