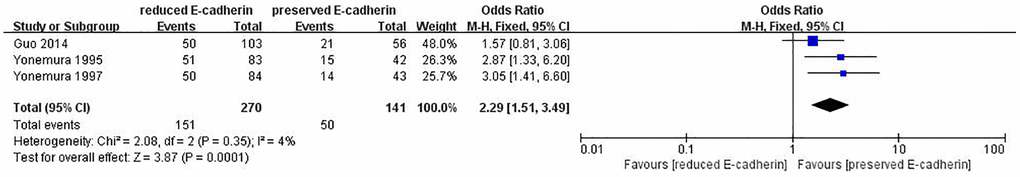
Figure 11.Forest plot of the odds ratio for the correlation of E-cadherin expression with tumor size (≥6 cm vs. <6 cm).
Figure 11 — Reduced expression of E-cadherin correlates with poor prognosis and unfavorable clinicopathological features in gastric carcinoma: a meta-analysis | Aging