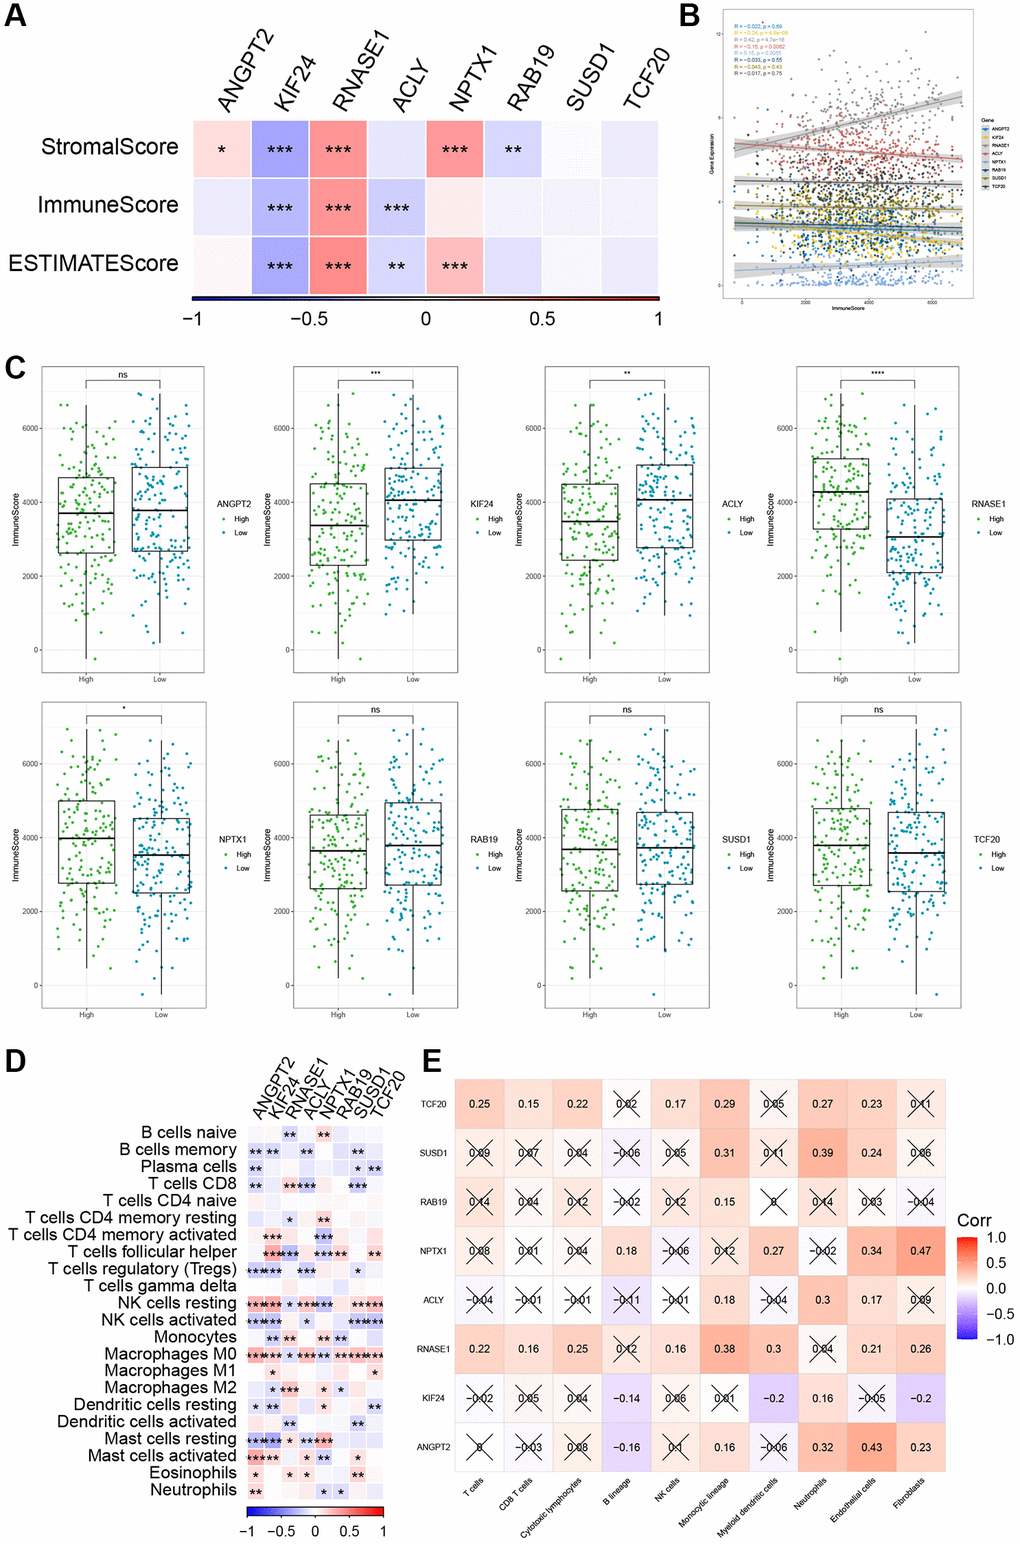
Figure 9.The relationship between the risk genes and immune landscape. (A, B) The correlation matrix of the risk genes and StromalScore, ImmuneScore, and ESTIMATEScore. (C) Comparison of high and low expression of 8 key genes and ImmuneScore. (D) Correlation between 8 key genes and immune cell score predicted by CIBERSORT analysis. (E) Correlation between 8 key genes and 10 immune cell types predicted by MCPcounter analysis. *P < 0.05, **P < 0.01, ***P < 0.001, and ****P < 0.0001.