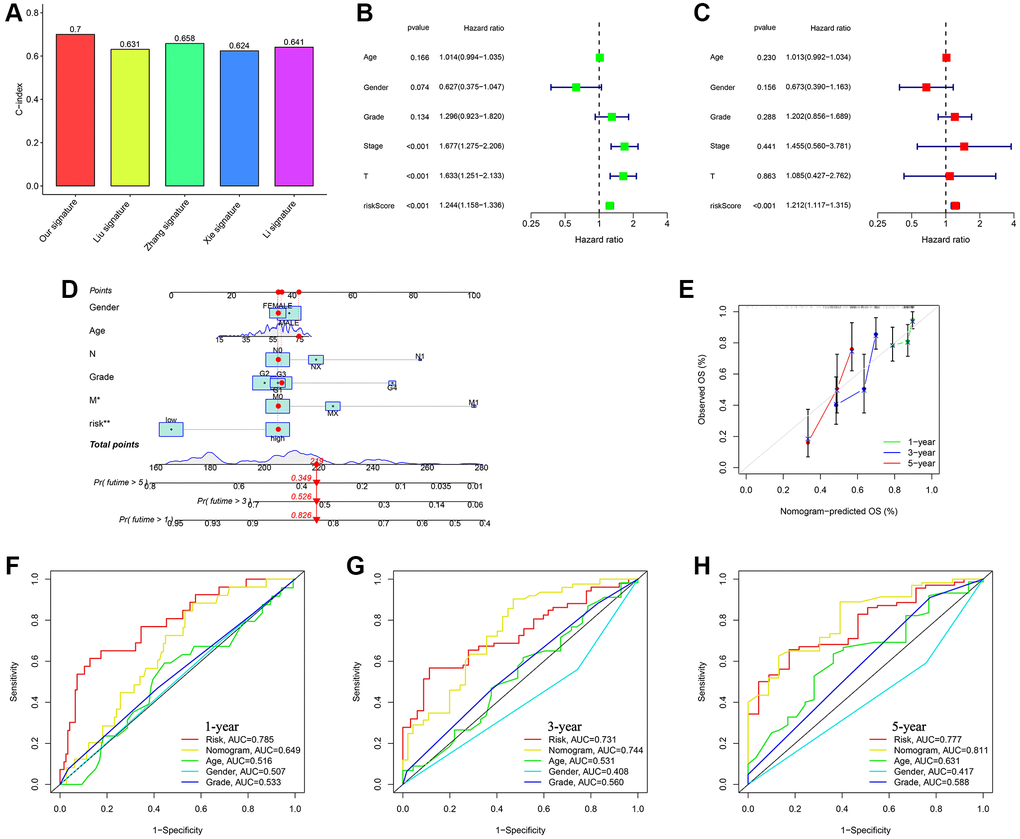
Figure 6.Assessing the durability of the gene signature associated with ubiquitination and creating the nomogram. (A) Evaluating four HCC models for comparison. (B) Cox analysis for TCGA-all set, considering only one variable at a time. (C) Cox analysis for TCGA-all set, considering multiple variables as independent factors. (D) The risk score and clinicopathological factors were used to create a predictive nomogram. (E) Calibration curves were created to compare the suggested nomogram with a perfect model. ROC curve analysis using multiple indices was conducted to examine the clinicopathological manifestations and nomogram for survival at 1-, 3-, and 5-year intervals (F–H).