Submit an Article
Navigate
Home
Editorial Board
Editorial Policies
Current Volume
Archive
Scientific Integrity
Publication Ethics Statements
Interviews with Outstanding Authors
Newsroom
Sponsored Conferences
Podcast
Contact
Special Collections
Submit an Article
Online ISSN: 1945-4589
Research Paper
|
Volume 16, Issue 11
|
pp. 10108–10131
Comprehensive evaluation of genes related to basement membrane in hepatocellular carcinoma
Back to article
Figure 10
(10 of 10)
−
100%
+
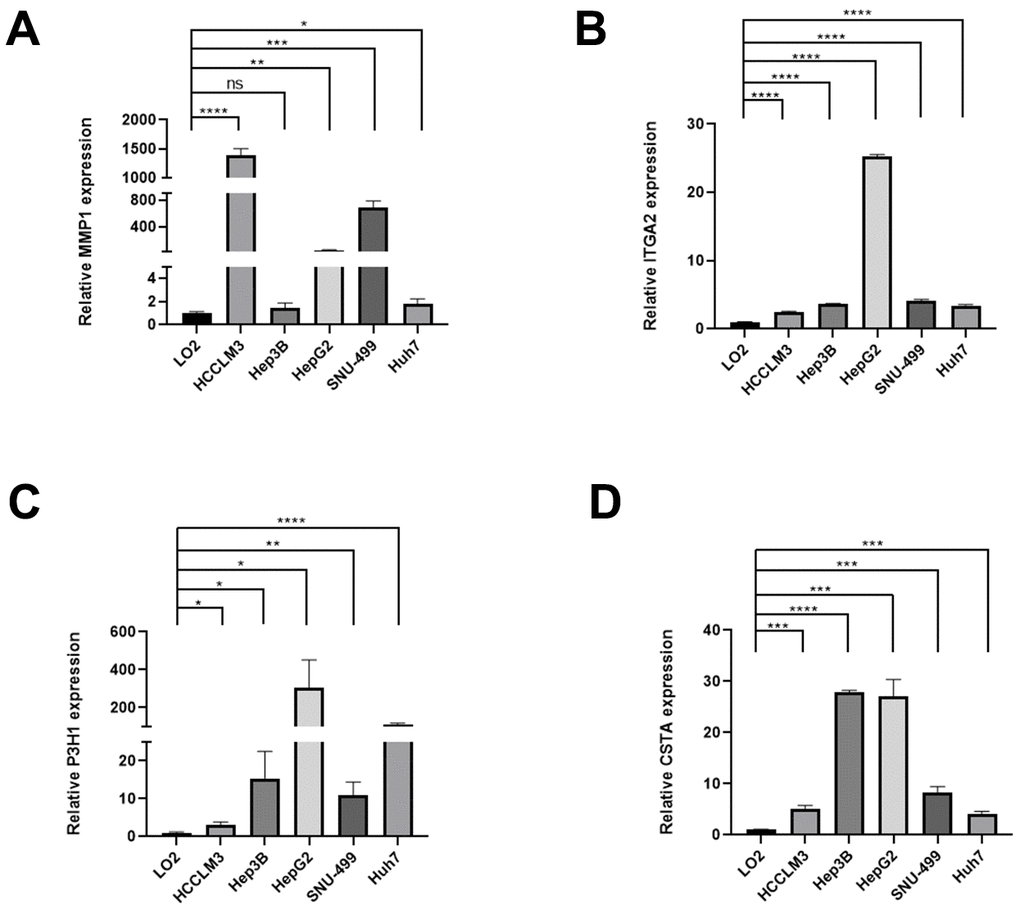
Figure 10.
The expression differences of normal liver and HCC cell lines.
The expression differences of MMP1 (
A
), ITGA2 (
B
), P3H1 (
C
), and CTSA (
D
) in normal liver and HCC cell lines.