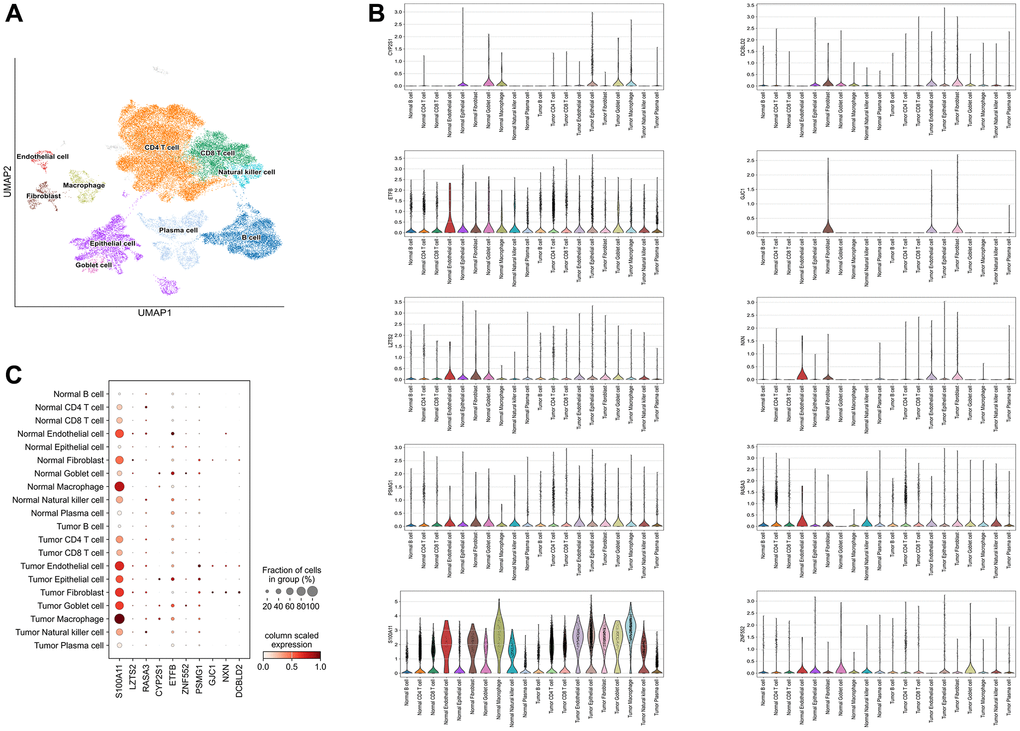
Figure 5.Single-cell analysis. (A) 10 types of cells were clustered. (B) The ten identified SERGs markers expressions were identified in CC single-cell clusters. (C) A bubble plot was employed to visually represent the gene expression characteristics.