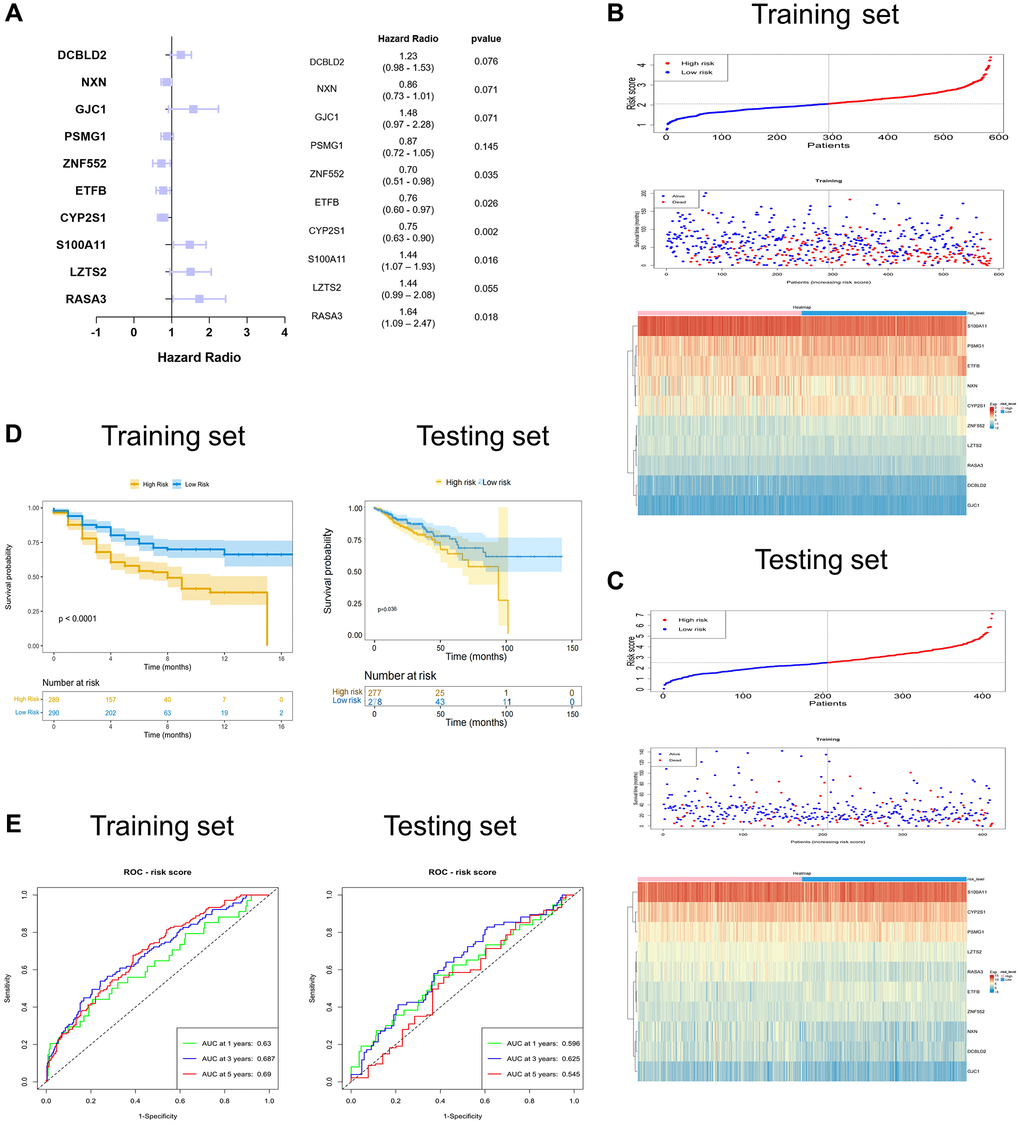
Figure 3.Identification and validation of the ten-SERGs risk model. (A) The forest plot of ten-SERGs prognostic model. The risk score distribution, survival status, and heat map of ten SERGs in (B) training set and (C) testing set. (D) Patients in low-risk groups had longer OS in the training set and testing set. (E) The ROC analysis of the SERGs risk model in the training set and testing set.