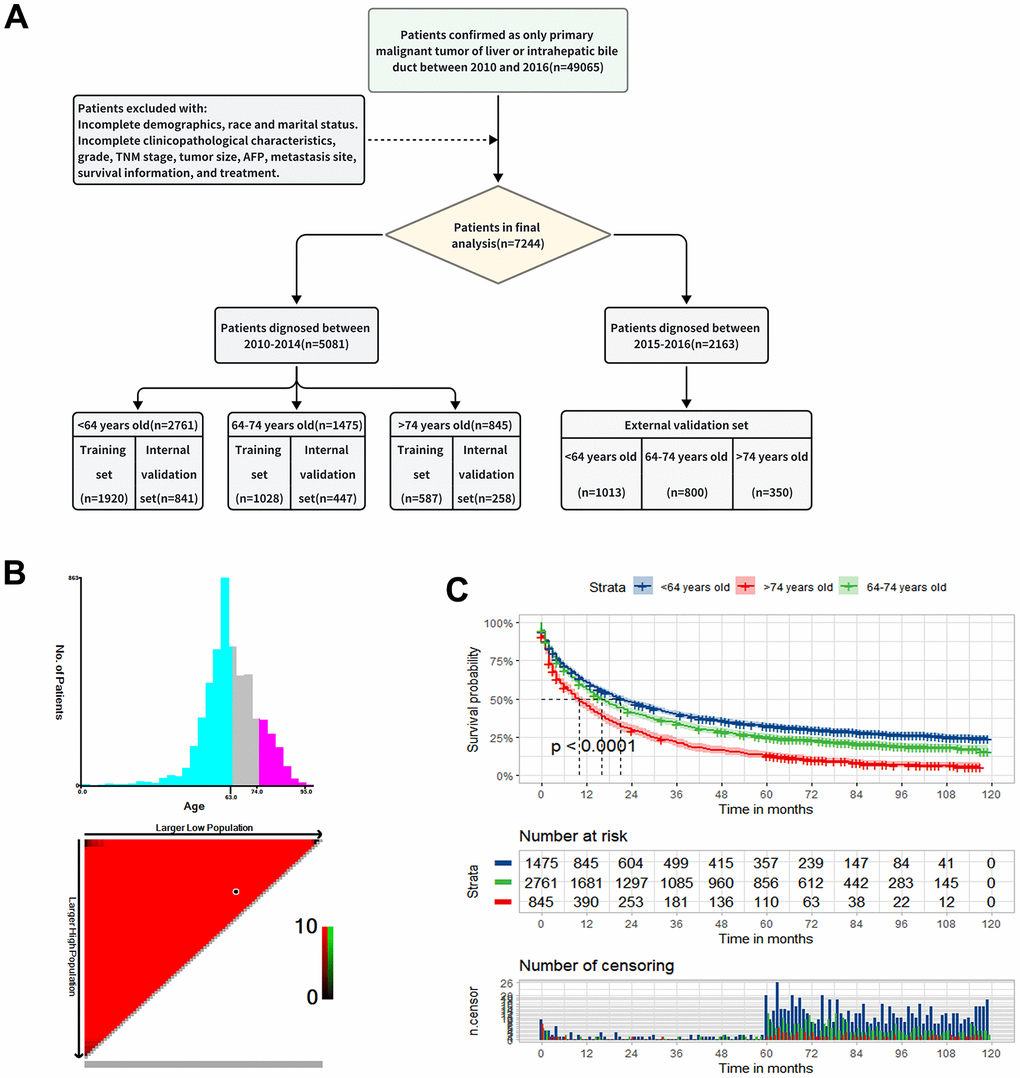
Figure 1.Study design and patient selection. (A) The study flow diagram. (B) The optimal age cut-off point for overall survival (OS) defined with X-tile software. (C) The Kaplan-Meier curve for overall survival among the low, middle and old age groups.