Submit an Article
Navigate
Home
Editorial Board
Editorial Policies
Current Volume
Archive
Scientific Integrity
Publication Ethics Statements
Interviews with Outstanding Authors
Newsroom
Sponsored Conferences
Podcast
Contact
Special Collections
Submit an Article
Online ISSN: 1945-4589
Research Paper
|
Volume 16, Issue 11
|
pp. 9709–9726
Identification of a unique stress response state of T cells-related gene signature in patients with gastric cancer
Back to article
Figure 1
(1 of 10)
−
100%
+
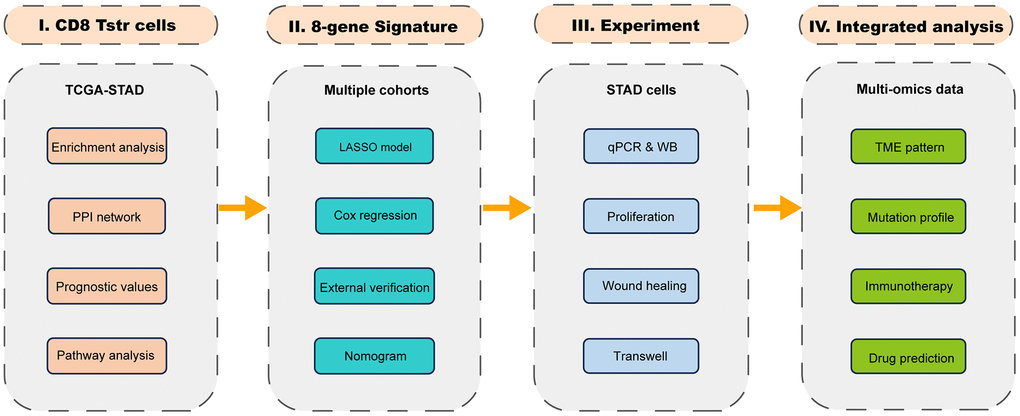
Figure 1.
The flow chart.
Figure 1 — Identification of a unique stress response state of T cells-related gene signature in patients with gastric cancer | Aging