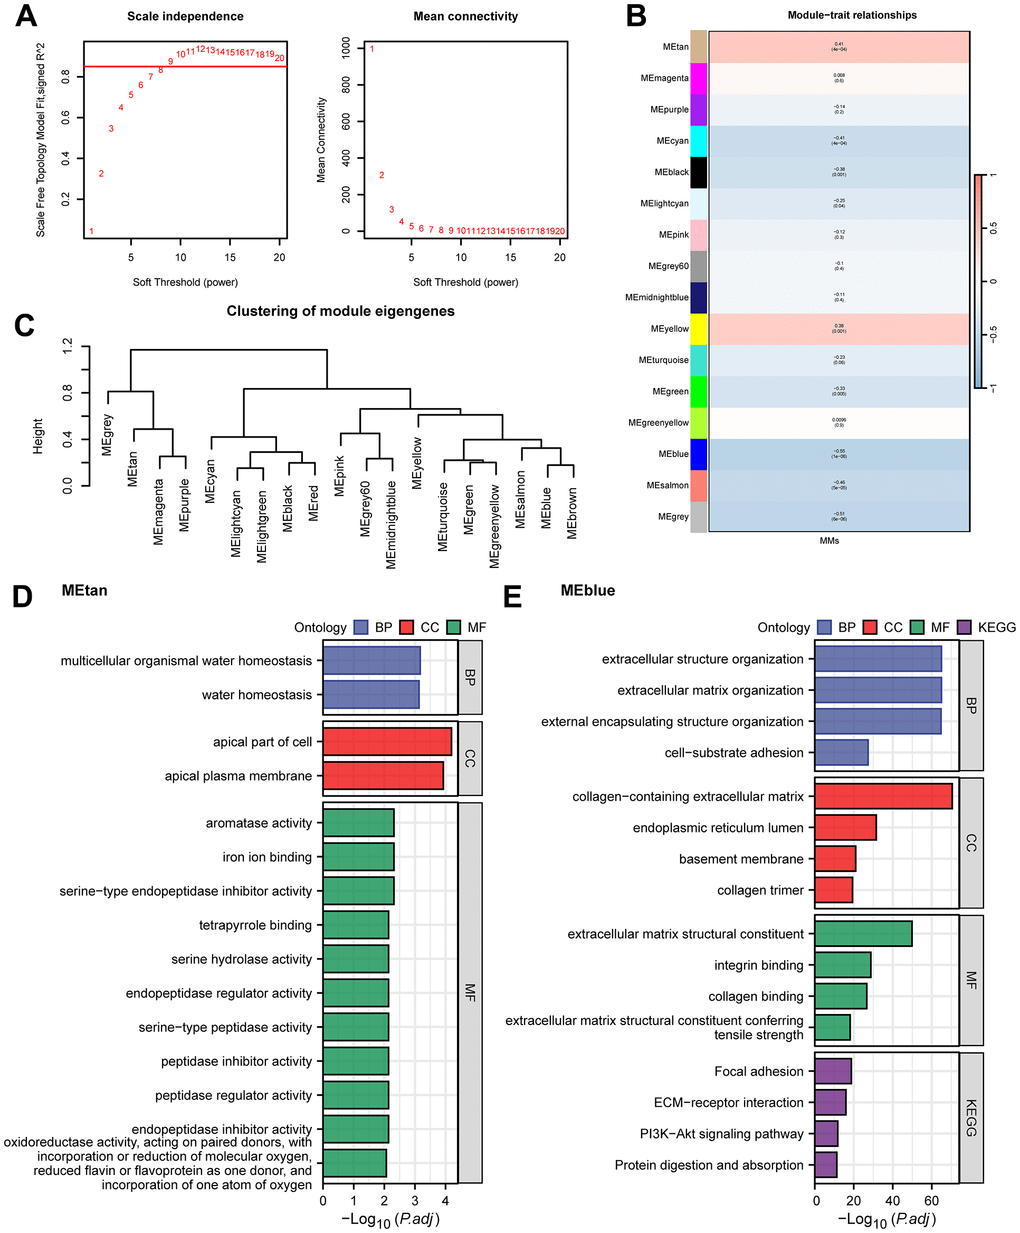
Figure 1.WGCNA analysis and GO/KEGG analysis. (A) WGCNA threshold screening graph. (B) The correlation heatmap between WGCNA module genes and MMs. (C) WGCNA module clustering tree. (D, E) GO/KEGG enrichment analysis of METan (D) module genes and MEblue (E) module genes.