Submit an Article
Navigate
Home
Editorial Board
Editorial Policies
Current Volume
Archive
Scientific Integrity
Publication Ethics Statements
Interviews with Outstanding Authors
Newsroom
Sponsored Conferences
Podcast
Contact
Special Collections
Submit an Article
Online ISSN: 1945-4589
Research Paper
|
Volume 16, Issue 11
|
pp. 9584–9598
The association between diabetes mellitus and prostate cancer: a meta-analysis and Mendelian randomization
Back to article
Figure 5
(5 of 5)
−
100%
+
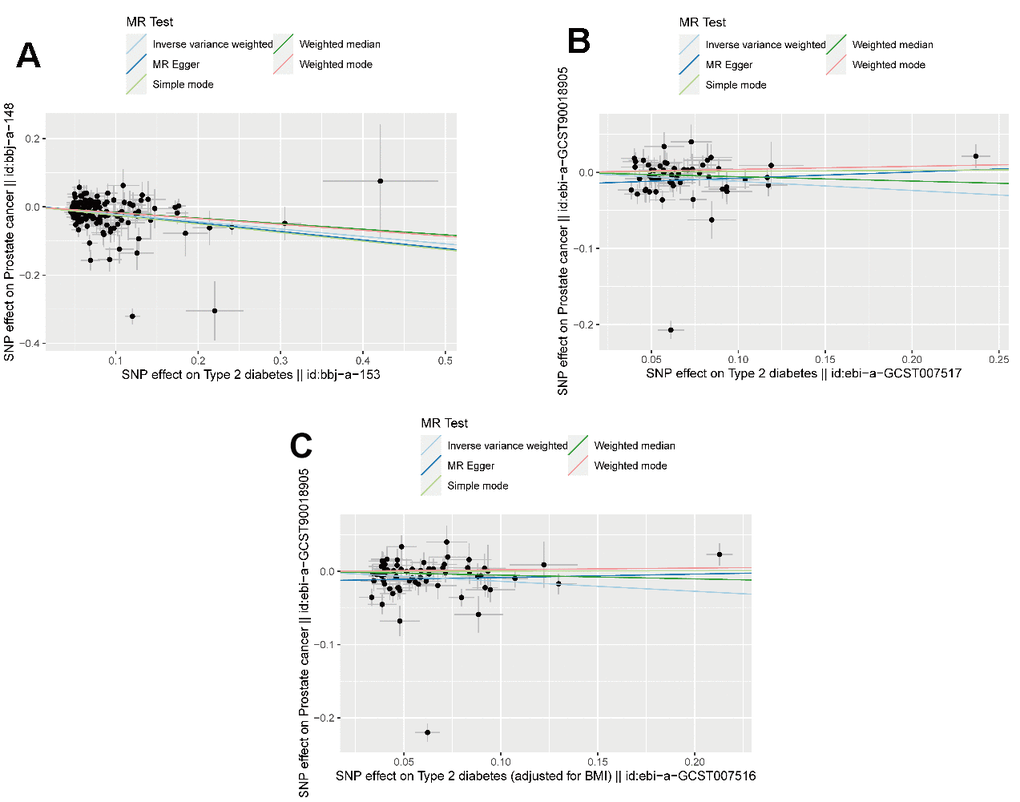
Figure 5.
The result of Mendelian randomization.
(
A
) The scatter plot of MR in East Asia population (
B
) The scatter plot of MR in European population (
C
) The scatter plot of MR in European population adjusted by BMI.