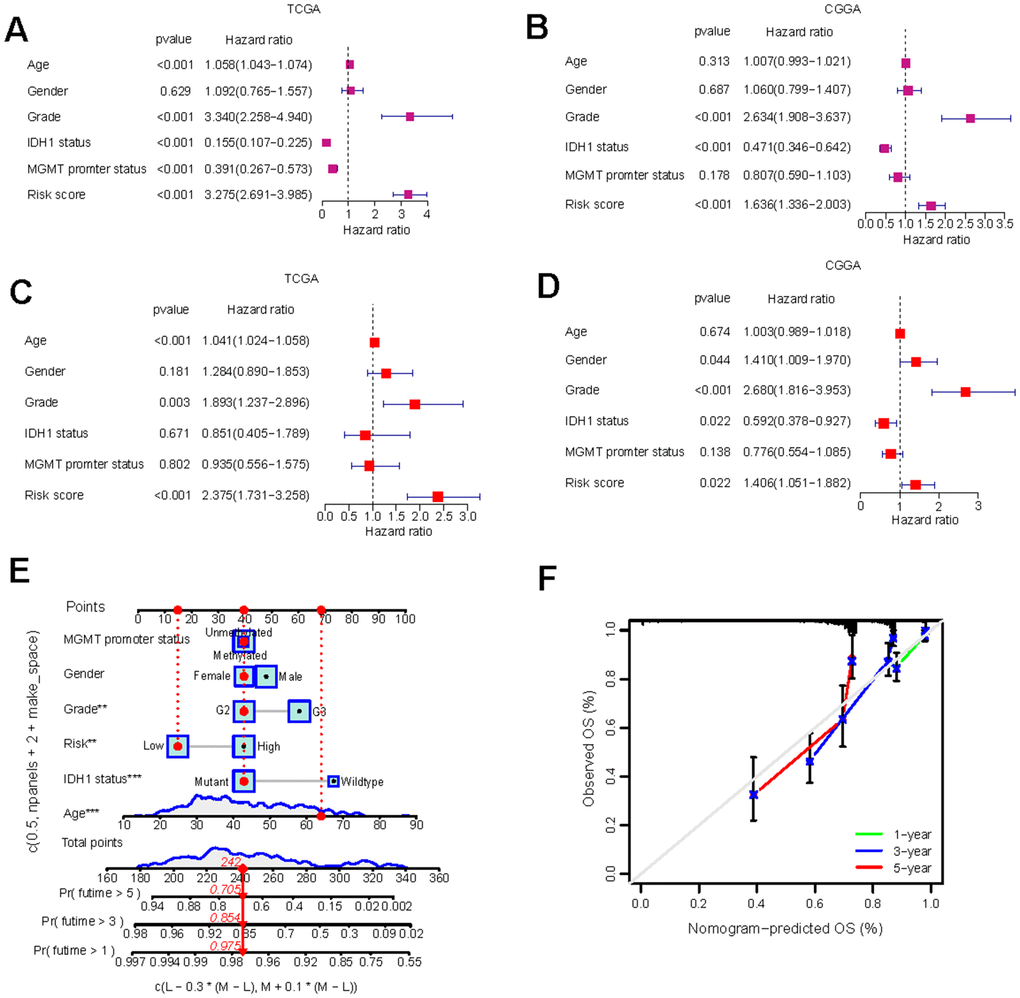
Figure 4.Independent prognostic analysis and the construction of nomogram. (A–D) Univariate Cox regression (A, B) and multivariate Cox regression (C, D) analysis of risk scores based on OS in TCGA-LGG and CGGA-LGG datasets. (E) Nomograms incorporating the GS and several clinical characteristics to predict the survival probability of LGG patients. (F) Calibration curves of the nomogram at 1-, 3-, and 5-year intervals.