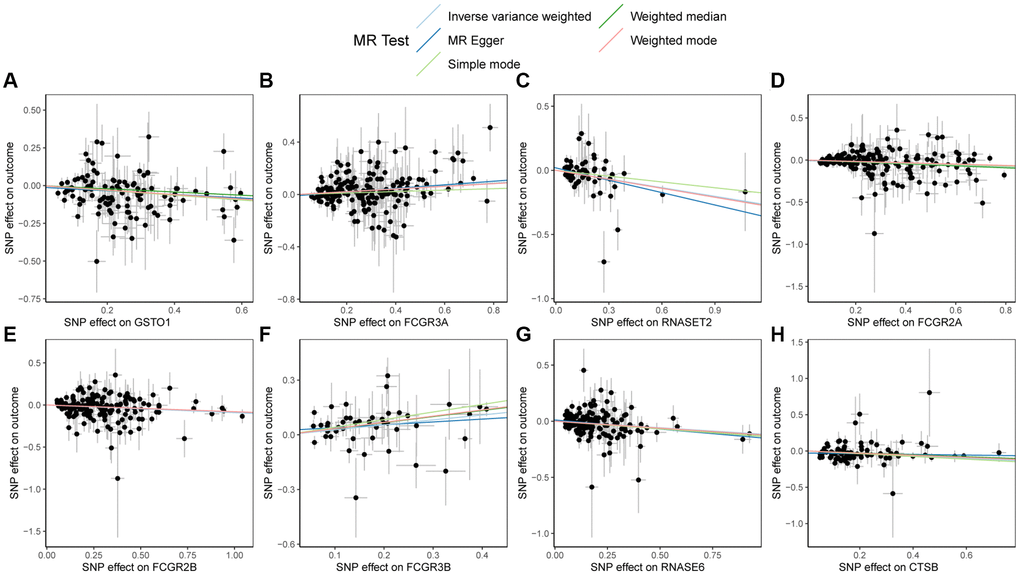
Figure 5.Scatter plots of Mendelian randomization (MR) results on PSC. (A) Scatter plot of MR results for GSTO1 and PSC; (B) Scatter plot of MR results for FCGR3A and PSC; (C) Scatter plot of MR results for RNASET2 and PSC; (D) Scatter plot of MR results for FCGR2A and PSC; (E) Scatter plot of MR results for FCGR2B and PSC; (F) Scatter plot of MR results for FCGR3B and PSC; (G) Scatter plot of MR results for RNASE6 and PSC; (H) Scatter plot of MR results for CTSB and PSC. Abbreviations: MR: Mendelian randomization; PSC: primary sclerosing cholangitis.