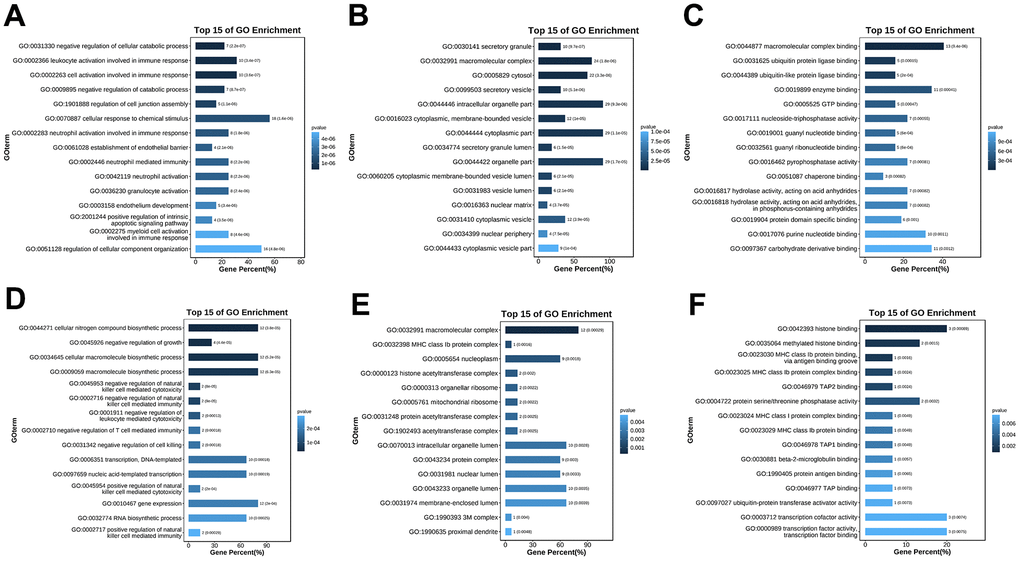
Figure 6.GO enrichment analysis of the hub genes. (A) GO (biological process) enrichment analysis of the upregulated differentially expressed genes. (B) GO (cellular component) enrichment analysis of the upregulated differentially expressed genes. (C) GO (molecular function) enrichment analysis of the upregulated differentially expressed genes. (D) GO (biological process) enrichment analysis of the downregulated differentially expressed genes. (E) GO (cellular component) enrichment analysis of the downregulated differentially expressed genes. (F) GO (molecular function) enrichment analysis of the downregulated differentially expressed genes.