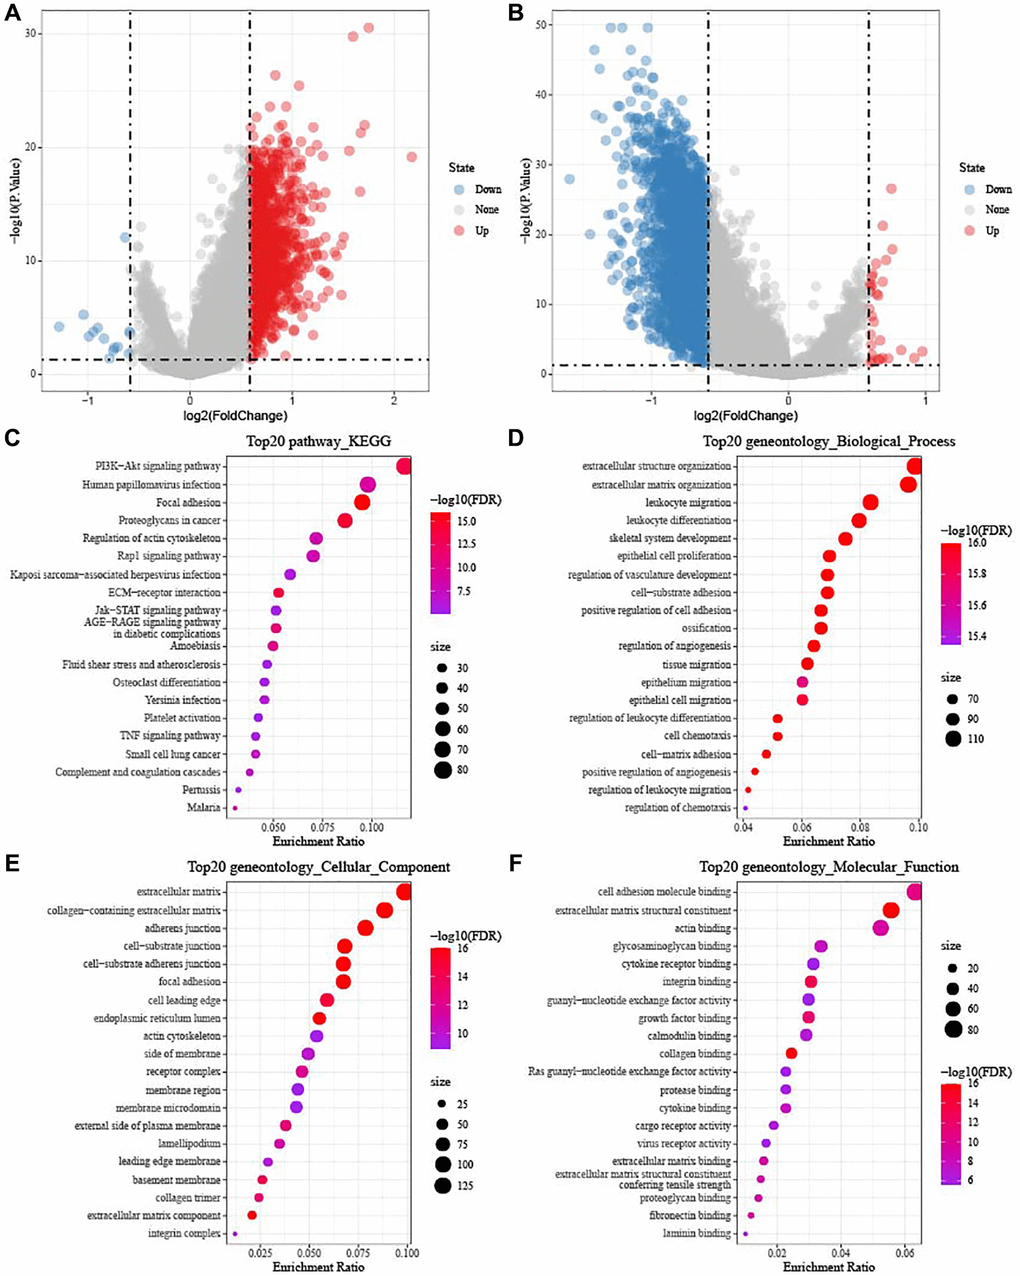
Figure 5.Identification of DEGs in TCGA-OV cohort. (A) Volcano diagram shows DEGs between subtype C1 and others. (B) The DEGs between subtype C3 and others were shown in volcano diagram. Blue dots mean genes with downregulated expression and red dots mean genes with upregulated expression. (C–F) Functional KEGG and GO enrichment analysis between subtype C1 and others.