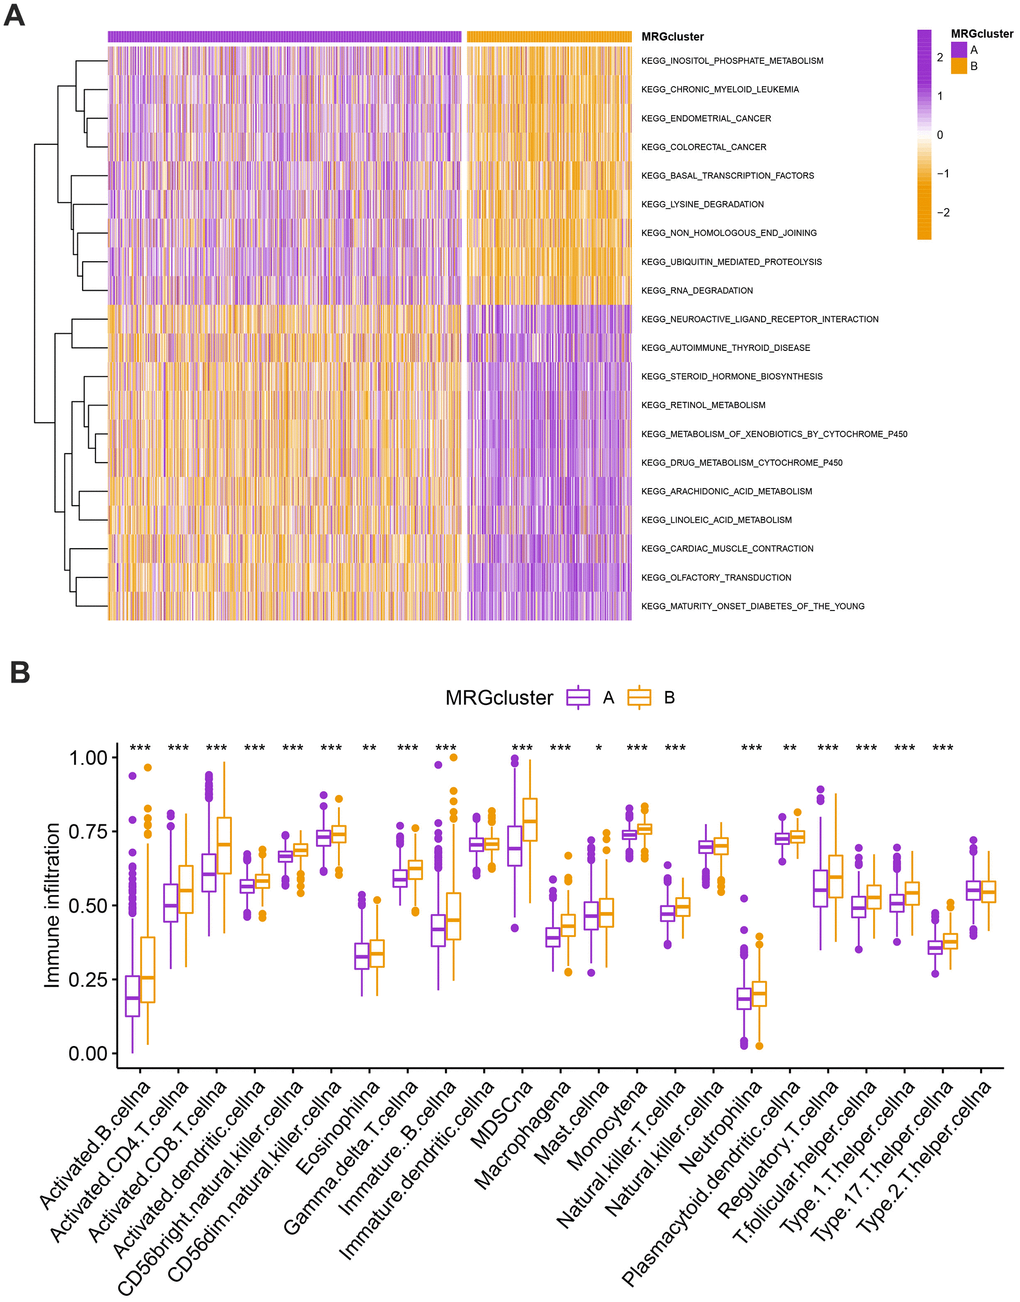
Figure 3.(A) Heatmap of significantly enriched KEGG subset of canonical pathways by GSEA analysis in A and B MRG clusters. (B) The infiltration levels of distinct immune cells in A and B MRG clusters were evaluated by ssGSEA analysis. *P<0.05, **P<0.01, ***P<0.001.