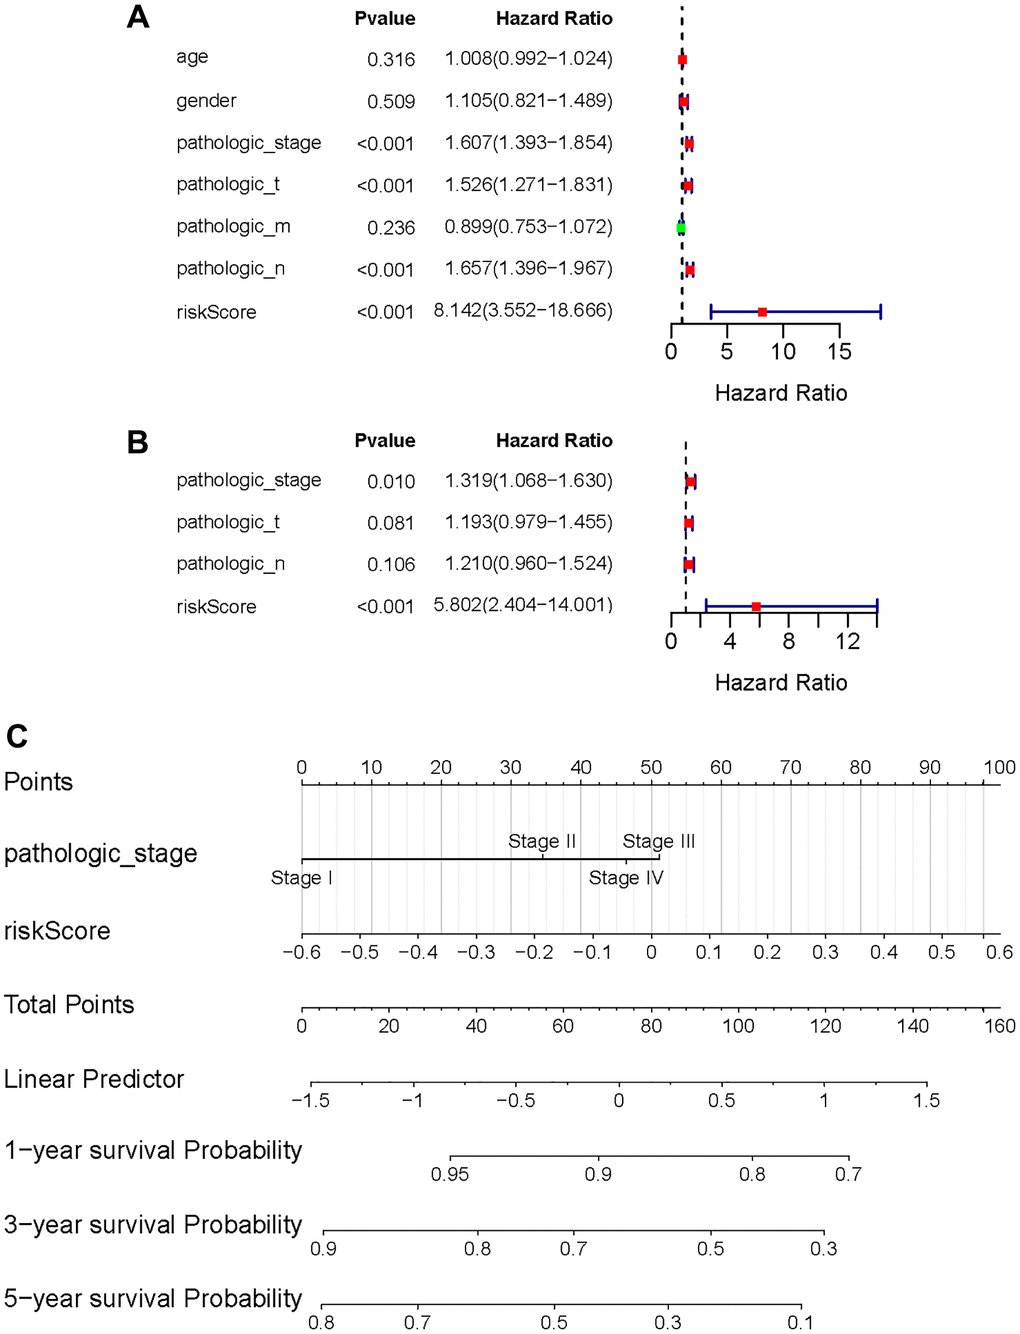
Figure 7.Independent value of the prognostic risk model. (A, B) Forrest plots of the univariate Cox regression analysis; (B) Forrest plot of the multivariate Cox regression analysis; (C) The nomogram was established based on the independent prognosis model.