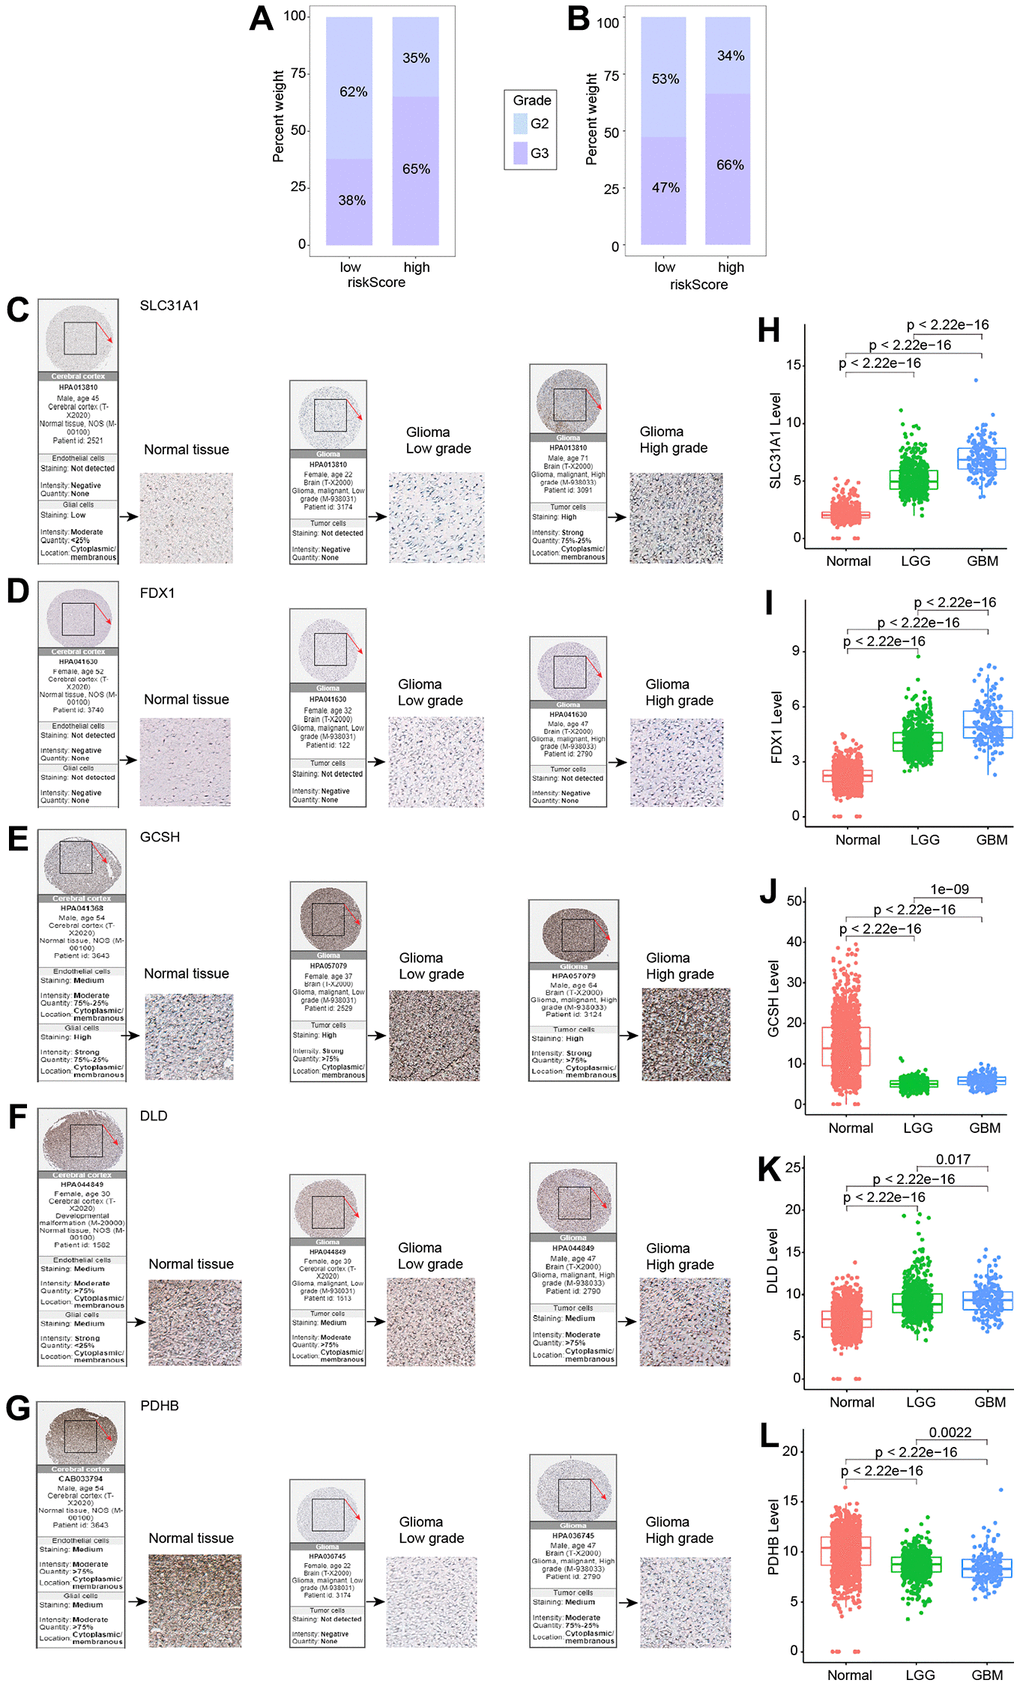
Figure 6.Expression of five genes in different tumor grades. (A) G2 and G3 distribution in high- and low-risk groups in the TCGA cohort. (B) G2 and G3 distribution in high- and low-risk groups in the CGGA cohort. (C–G) Five genes examined via IHC. (H–L) Expression of five genes in normal, LGG, and GBM.