Submit an Article
Navigate
Home
Editorial Board
Editorial Policies
Current Volume
Archive
Scientific Integrity
Publication Ethics Statements
Interviews with Outstanding Authors
Newsroom
Sponsored Conferences
Podcast
Contact
Special Collections
Submit an Article
Online ISSN: 1945-4589
Research Paper
|
Volume 16, Issue 10
|
pp. 8697–8716
A cuproptosis-based prognostic model for predicting survival in low-grade glioma
Back to article
Figure 4
(4 of 12)
−
100%
+
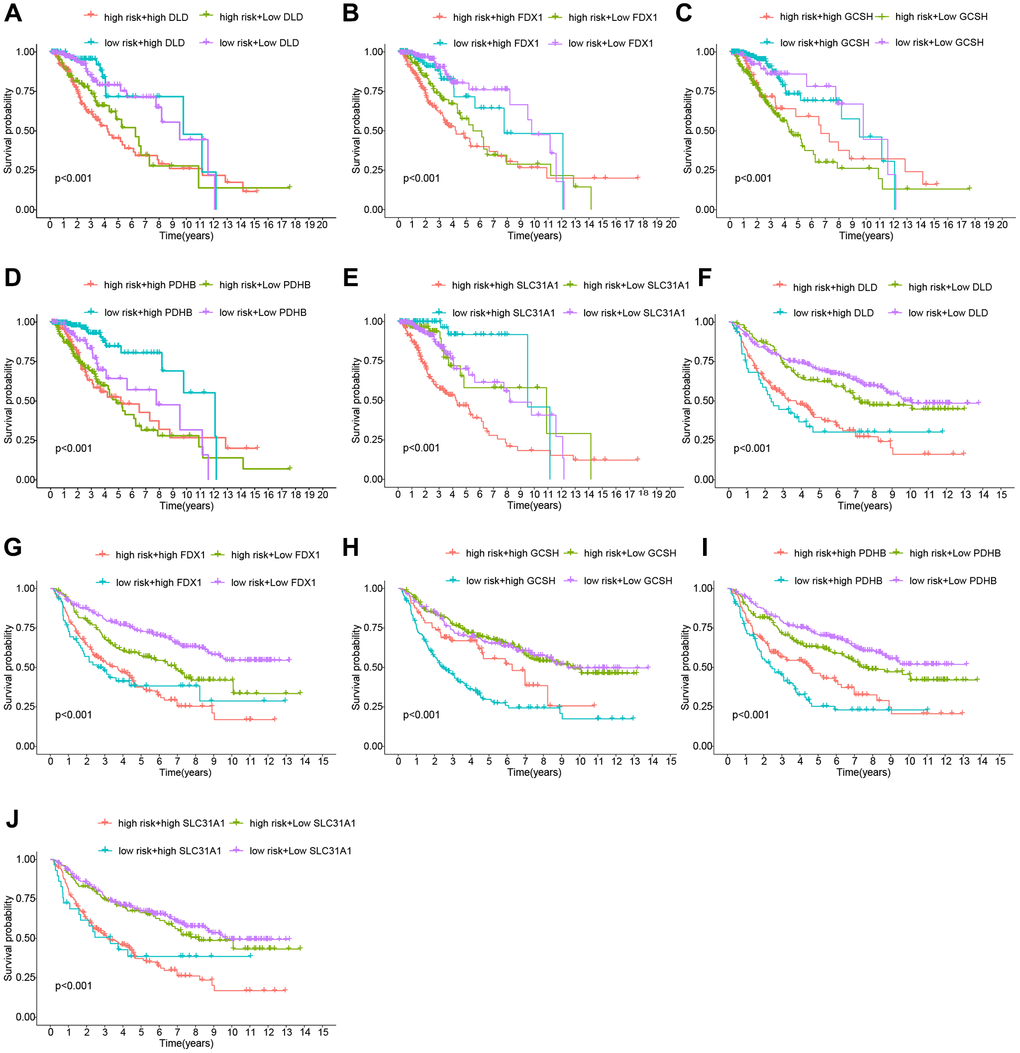
Figure 4.
Analysis of the risk Scores and genes for survival.
(
A
–
E
) Cohort of the TCGA. (
F
–
J
) Cohort of the CGGA.
Figure 4 — A cuproptosis-based prognostic model for predicting survival in low-grade glioma | Aging