Submit an Article
Navigate
Home
Editorial Board
Editorial Policies
Current Volume
Archive
Scientific Integrity
Publication Ethics Statements
Interviews with Outstanding Authors
Newsroom
Sponsored Conferences
Podcast
Contact
Special Collections
Submit an Article
Online ISSN: 1945-4589
Research Paper
|
Volume 16, Issue 10
|
pp. 8667–8686
Identification of a novel matrix metalloproteinases-related prognostic signature in hepatocellular carcinoma
Back to article
Figure 7
(7 of 7)
−
100%
+
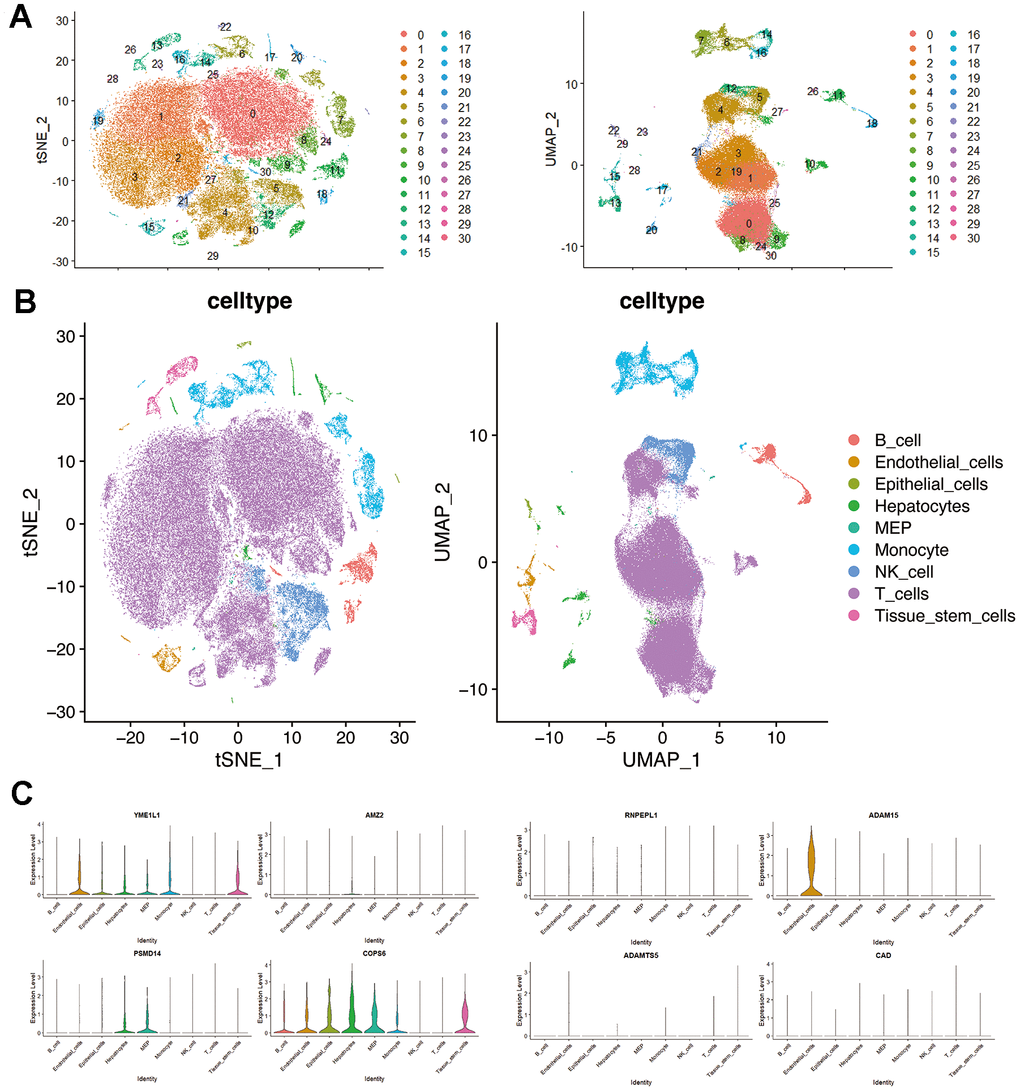
Figure 7.
Single-cell RNA-seq profiling in hepatocellular carcinoma.
(
A
) t-SNE and UMAP plots colored by different cell clusters. (
B
) The cell types are identified by marker genes. (
C
) Expression of MMPs-related prognostic signature in each cluster.