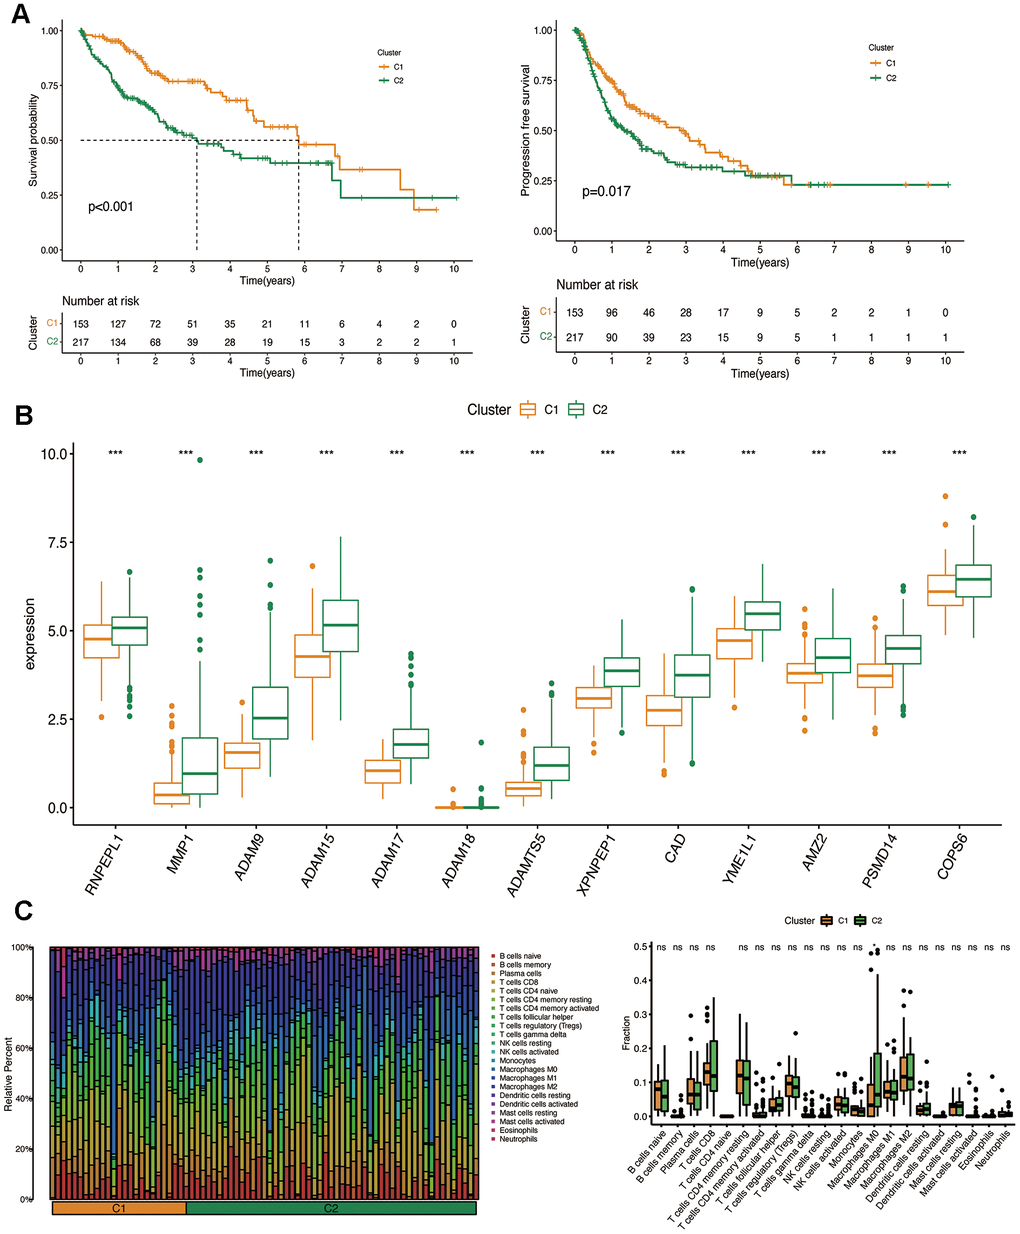
Figure 3.Clinicopathological characteristics of the two clusters classified by prognostic MMPs-related DEGs. (A) Kaplan–Meier curves for the OS and PFS in the two clusters. (B) Comparison of the expression of survival-related MMPs genes in the two clusters. (C) CIBERSORT analysis of infiltrating immune cells in the two clusters.