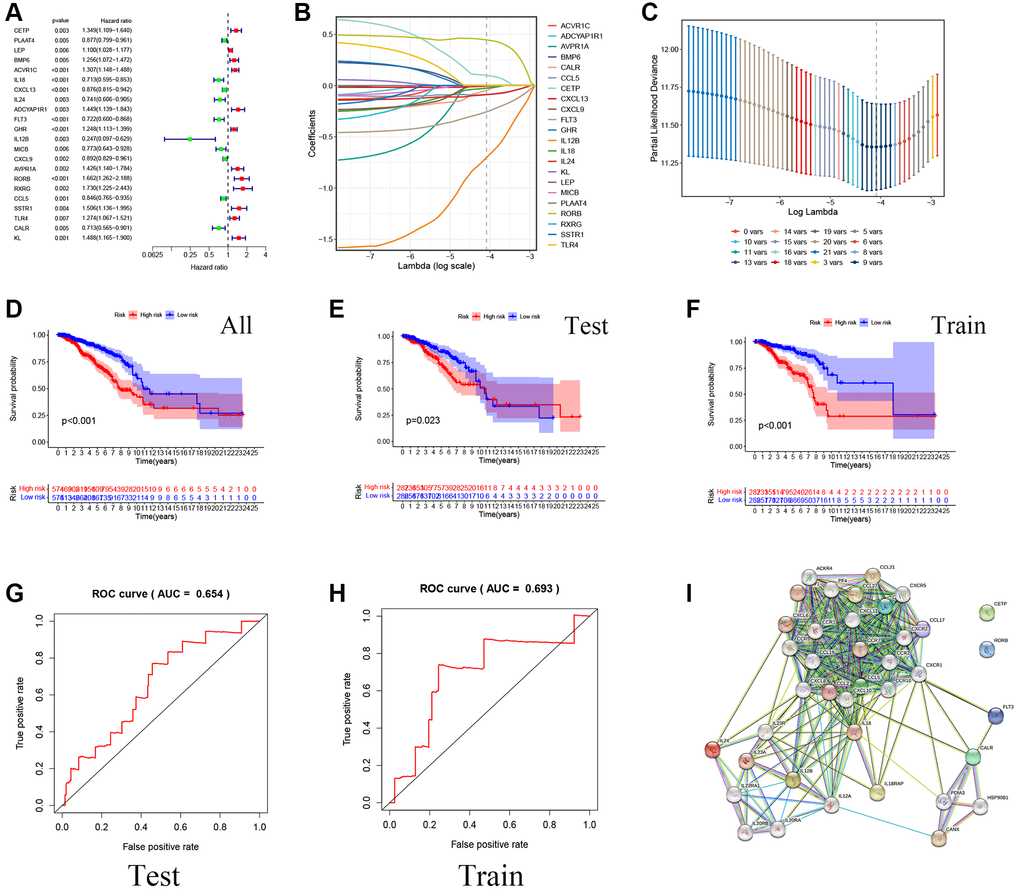
Figure 2.Construction of a prognostic model for Breast cancer patients based on immune-related and lipid metabolism-related DEGs. (A) The forest map shows the results of single factor analysis. (B–C) LASSO coefficient profile analysis and cross-validation to identify the most useful prognostic genes. (D–F) Kaplan-Meier curves of OS in the TCGA cohort based on risk score. (G–H) The time-dependent ROC curves for the prognostic signature base on risk score. (I) Construction of Prognostic gene PPI network based on STRING database.