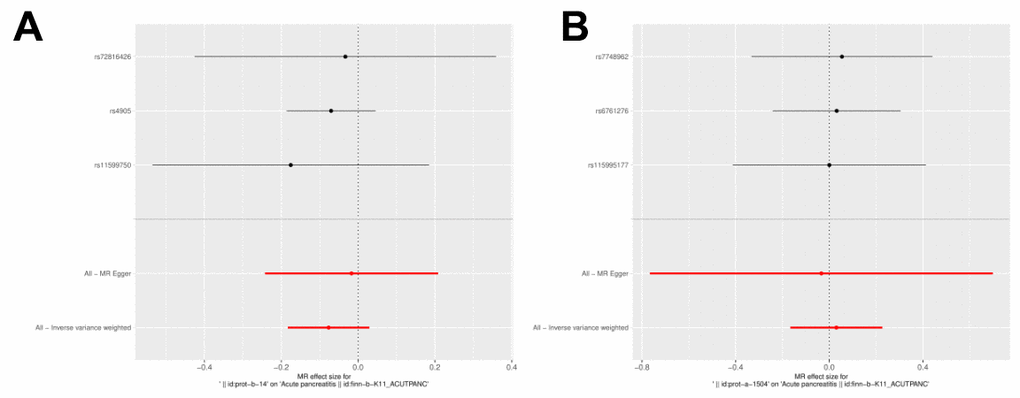
Figure 4.Scatter plot and effect estimates for four main estimators. (A) All 3 SNPs are plotted together with 95% confidence intervals representing their effect on both IL-27 (horizontal access) and on AP (vertical axis). (B) All 3 SNPs are plotted together with 95% confidence intervals representing their effect on both IL-1RN (horizontal access) and on AP (vertical axis).