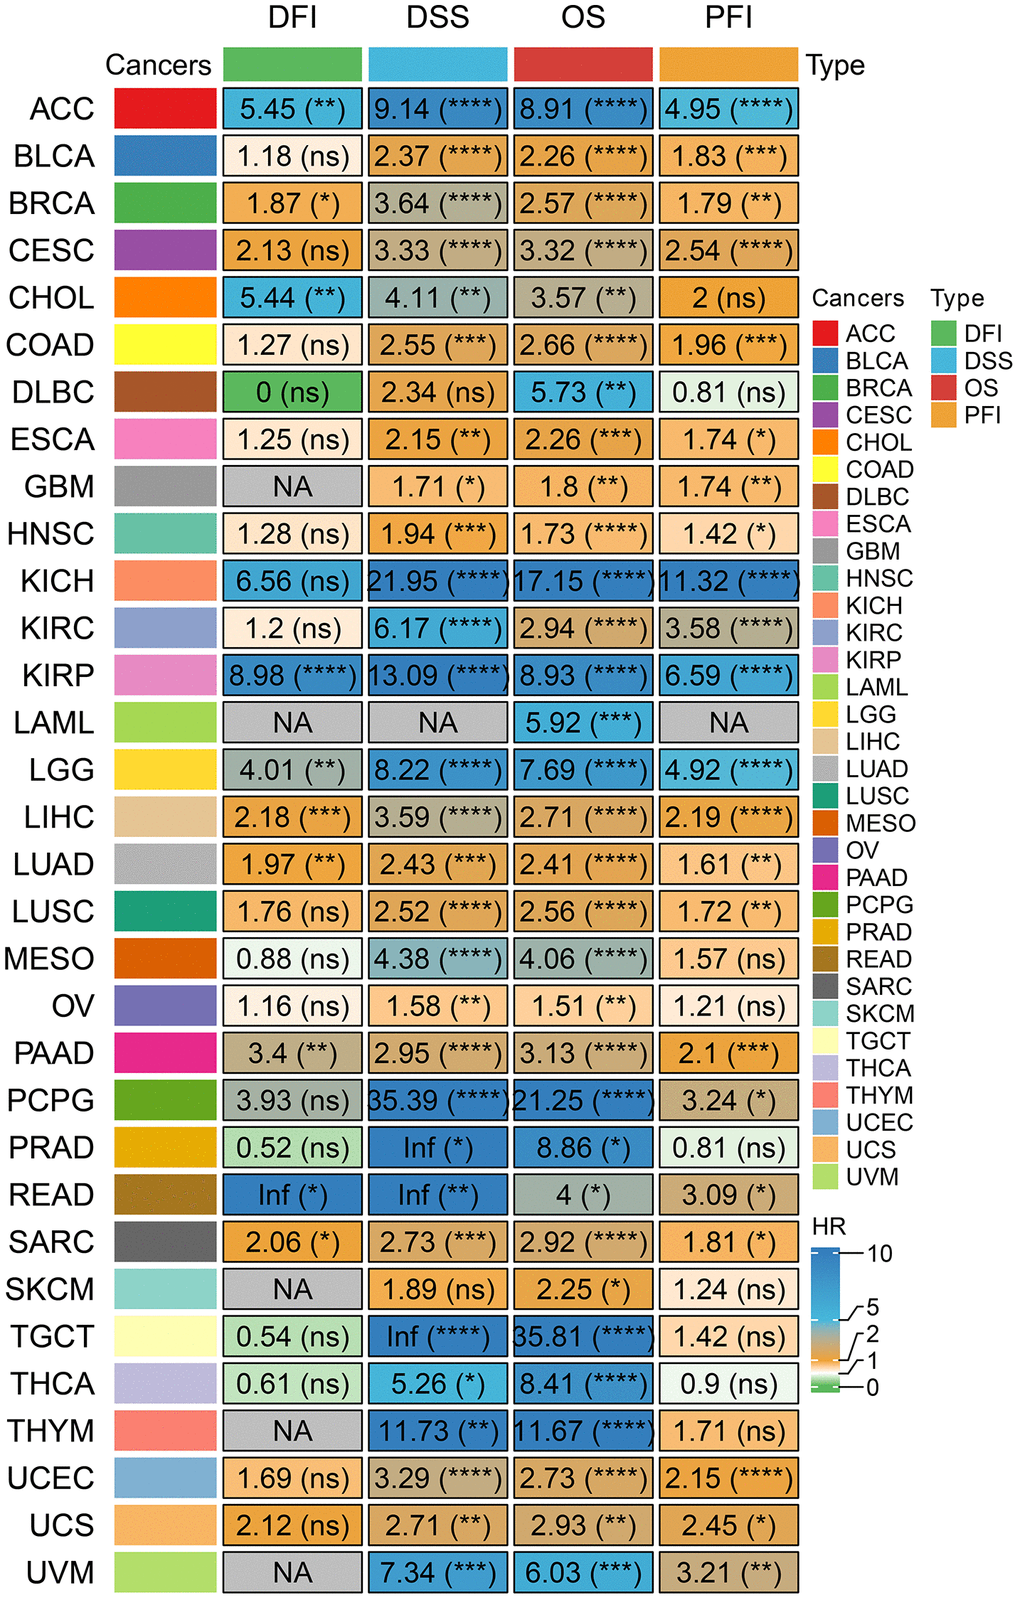
Figure 8.Prognostic analysis of our riskscore signature at different times in pan cancer. (The numbers inside represent the HR value, and the *in parentheses after it represents the log Rank P-value of HR. *P < 0.05, **P < 0.01, ***P < 0.001, and ****P < 0.0001. The gray NA represents that there is no corresponding survival time and status in the tumor or that HR values cannot be calculated).