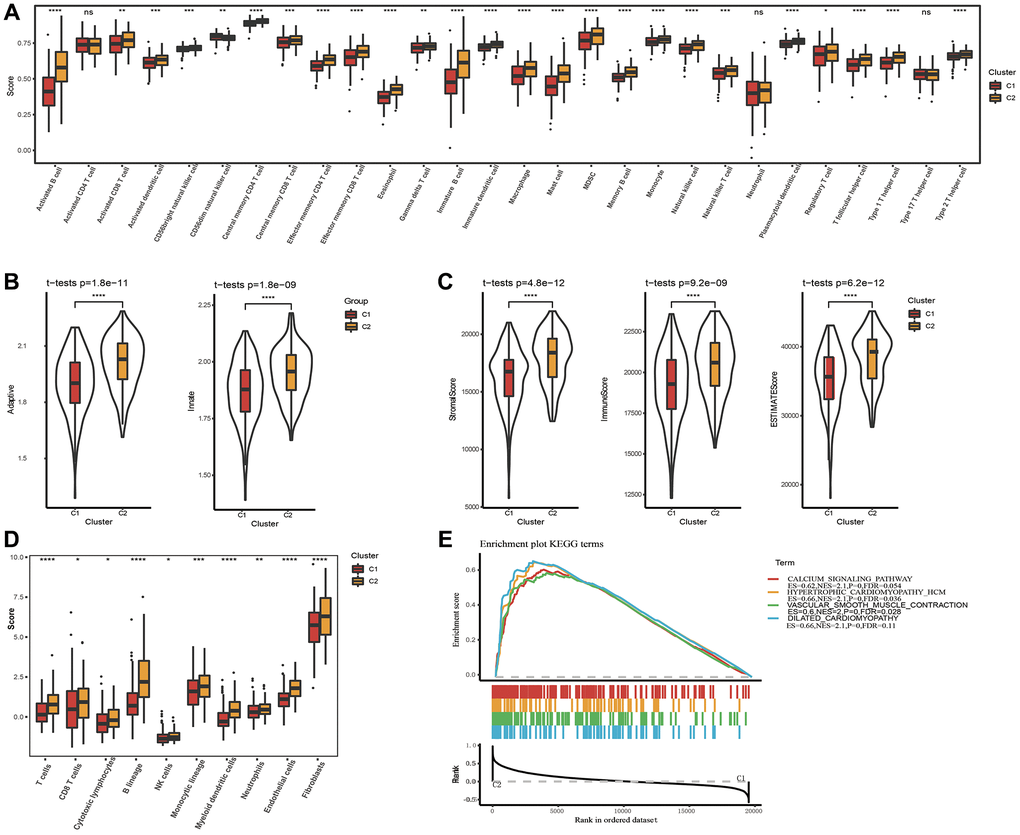
Figure 3.Analysis of immune infiltration and gene set enrichment analysis. (A) Analysis of 28 immune cells using CIBERSORT. (B) The distribution of innate and acquired immunity in TCGA-STAD dataset. (C) Analysis of immune infiltration using ESTIMATE. (D) Analysis of immune infiltration using MCP-counter. (E) GSEA pathways score analysis between C1 and C2 in TCGA-STAD. *p < 0.05, **p < 0.01, ***p < 0.001, ***p < 0.0001. Abbreviation: ns: no significance.